The Vantix Advantage: Stability and Calibration Performance of Portable FT-Raman Compared to Dispersive Raman Systems
Raman spectroscopy is a cornerstone technique for raw material identification (RMID), process analytical technology (PAT), and decentralized quality assurance in pharmaceutical and chemical manufacturing. However, the reliability of Raman-based identification depends directly on the stability of the instrument’s wavelength and intensity calibration. Dispersive Raman systems, whether handheld or benchtop, are known to suffer from drift, instrument-to-instrument variability, and fluorescence interference, all of which degrade spectral matching metrics such as Hit Quality Index (HQI) and Pearson’s correlation (r²).
The VantixTM portable FT-Raman system achieves a level of calibration stability that is not feasible with dispersive architectures. Leveraging Connes’s Advantage, single-channel detection, and interferometric metrology, FT-Raman inherently maintains perfect wavelength accuracy and long-term intensity stability without user intervention. This white paper explains why these advantages matter, quantifies their impact on spectral matching, and demonstrates how Vantix FT-Raman reduces operational burden while increasing confidence in identification outcomes.
Understanding the Sensitivity of Spectral Matching Metrics
HQI and r² are widely used to quantify how closely an unknown spectrum (U) matches a validated library spectrum (L). Both rely on point-by-point comparisons after normalization. In practice:
HQI values near 0 indicate an excellent match.
r² values near 1 indicate near-identical spectral shape.
Even small deviations (1-2 cm⁻¹ shifts or minor intensity differences) can produce large degradations in these metrics.
This is a critical challenge for dispersive Raman instruments. Because these systems depend on gratings, CCD or CMOS detector arrays, and fixed-wavelength diode lasers, small variations in alignment, temperature, or component aging produce non-negligible changes in spectral appearance. Instrument-to-instrument comparability becomes difficult, and maintaining reliable library matching requires a heavy calibration burden.
Calibration Requirements in Dispersive Raman
Wavenumber (Frequency) Calibration - ASTM E1840
ASTM E1840 defines best practices for calibrating the Raman shift axis using well-characterized standards (polystyrene, sulfur, cyclohexane, naphthalene). A key step is obtaining accurate reference peak positions.
The common and scientifically rigorous approach is:
Measure the Raman calibration standards on a frequency-accurate FT-Raman system, where Connes’s Advantage ensures that peak positions are effectively exact. These FT-derived peak positions are then treated as exact and used to fit the pixel-to-wavenumber calibration polynomial in a dispersive Raman instrument.
Since dispersive spectrometers are linear in wavelength, not Raman shift, the calibration curve is necessarily non-linear, typically requiring higher-order polynomials. Unfortunately, this mapping drifts over time due to:
laser wavelength instability
grating aging
environmental and system warmup induced thermal fluctuations
optical alignment changes
As a result, many GMP workflows require:
daily or per-run calibration
continuous monitoring for drift
documentation for compliance
Intensity Calibration — NIST SRM 2241
Intensity calibration ensures that spectral shapes, not just peak positions, remain consistent across instruments and over time. NIST SRM 2241 provides a fluorescent reference with a well-certified emission profile defined by a 5th-order polynomial:

where Δν is the Raman shift relative to 785 nm. You need a different standard for other wavelengths!
Challenges for dispersive Raman include:
High cost of the standard (≈ $3,580)
Need for instrument-specific calibration curves
Drift in intensity response due to CCD aging, grating efficiency changes, and optical contamination
Recommended periodic recalibration
Together, these factors increase the operational and compliance burden of dispersive Raman.
FT-Raman Technology: Eliminating Calibration Drift at the Source
Connes’s Advantage - Perfect Frequency Calibration
FT-Raman spectrometers use a Michelson interferometer referenced to a stabilized internal metrology laser. In the Vantix the metrology laser is the actual Raman laser and laser instability is therefore compensated. The Raman frequency axis is derived from counting precise and invariant interference fringes.
Thus, FT-Raman inherently provides:
absolute wavenumber accuracy
no pixel-to-wavenumber polynomial
no grating- or detector-based drift
no need for external calibration standards
Connes’s Advantage ensures that a Vantix FT-Raman instrument remains perfectly calibrated over its lifetime, eliminating the largest source of variability in dispersive systems.
Simplified Intensity Response from Single-Channel Detection
Unlike dispersive systems, which depend on a CCD or CMOS array with wavelength-dependent sensitivity, FT-Raman uses:
a single avalanche photodiode (APD)
reflective optics
broadband throughput
This architecture yields a stable, flat-response intensity profile with negligible drift. Most FT-Raman systems require only a single factory intensity calibration.
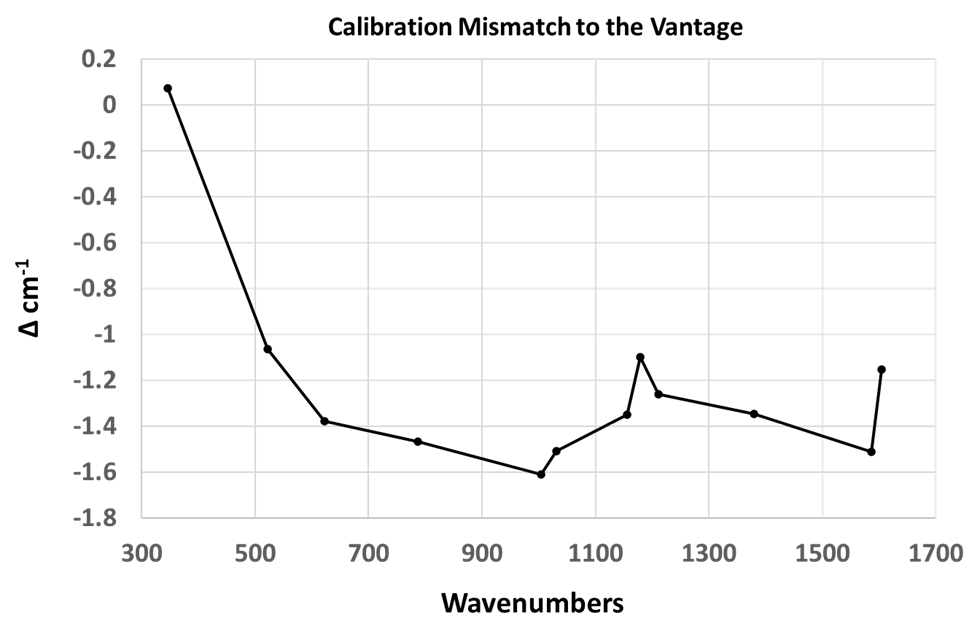
Quantitative Example: FT-Raman vs Dispersive Raman
To illustrate the practical impact of these stability differences, spectra of toluene were acquired using:
Vantix 830 nm portable FT-Raman
a 785 nm dispersive Raman system
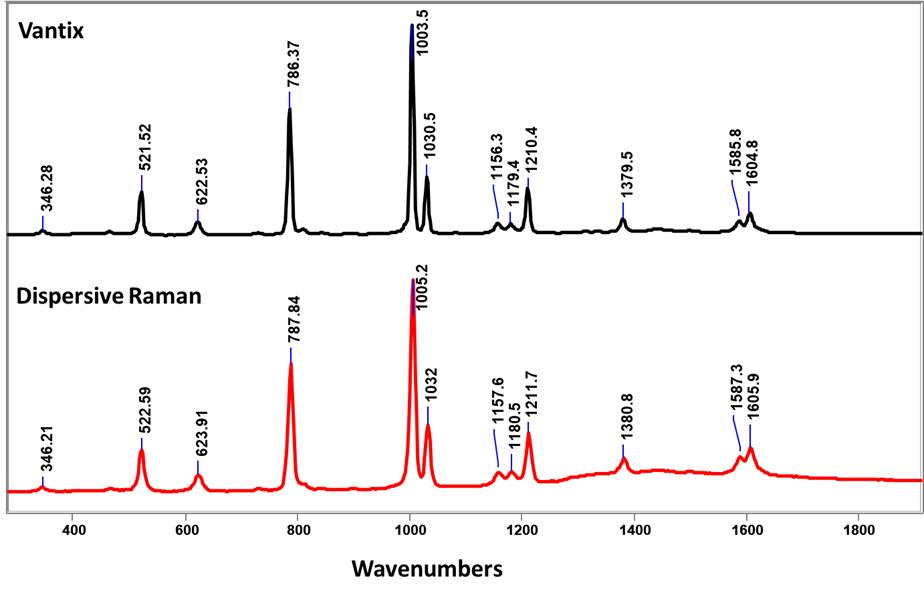
Key observations:
FT-Raman exhibits higher resolution, despite a smaller instrument footprint.
The dispersive spectrum shows a baseline fluorescence contribution from the sample container.
A small wavenumber misalignment (~1.5 cm⁻¹) between systems, common in dispersive Raman, reduces the correlation to r² = 0.88 and yields HQI = 0.095.
By common RMID standards, these spectra would not be judged to represent the same material, underscoring the importance of calibration stability.
Why Stability Matters for PAT (Process Analytical Technology)
PAT applications require long-term spectral consistency to maintain validated chemometric models. Dispersive Raman faces several recurring challenges:
lFluorescence Interference
The primary failure mode of dispersive Raman in PAT assays. FT-Raman avoids most fluorescence due to longer wavelength excitation.
Probe Fouling and CIP/SIP Limitations
Any contamination on the probe window alters intensity and baseline. FT-Raman’s stable intensity response makes it more robust to these deviations.
Model Robustness
Dispersive Raman models drift due to:
laser wavelength variations
grating or detector aging
thermal instability
alignment changes
These force frequent recalibration or model retraining.
Calibration Burden
Dispersive Raman requires:
daily/weekly wavenumber checks (ASTM E1840)
periodic intensity recalibration (SRM 2241)
documentation for regulatory compliance
FT-Raman eliminates nearly all of these requirements, making it ideal for continuous manufacturing, real-time release testing, and decentralized QC environments.
Conclusion
HQI and r² are unforgiving spectral-matching metrics that heavily penalize even small differences in peak position and intensity. Dispersive Raman systems depend on polynomial wavenumber calibration and periodic intensity correction, both of which drift over time and require significant user management.
In contrast, the Vantix portable FT-Raman system delivers:
perfect, drift-free wavenumber calibration (Connes’s Advantage)
long-term intensity stability from single-channel detection
minimal calibration burden
superior instrument-to-instrument consistency
robust performance in PAT and RMID workflows
By eliminating the root causes of drift and variability, FT-Raman enables higher confidence in identification, fewer false rejections, and more reliable QC outcomes, especially in environments where traditional dispersive Raman struggles.