
Unique Raman Sampling Benefits of the Jacquinot’s Advantage
In our earlier white paper, Understanding the Advantages of FT-Raman, we discussed how the Jacquinot Advantage benefits Fourier transform spectroscopy. In the context of FT-IR, Jacquinot’s Advantage is often described as the ability to maintain high optical throughput independent of spectral resolution. This is illustrated below in Figure 1 and 2.
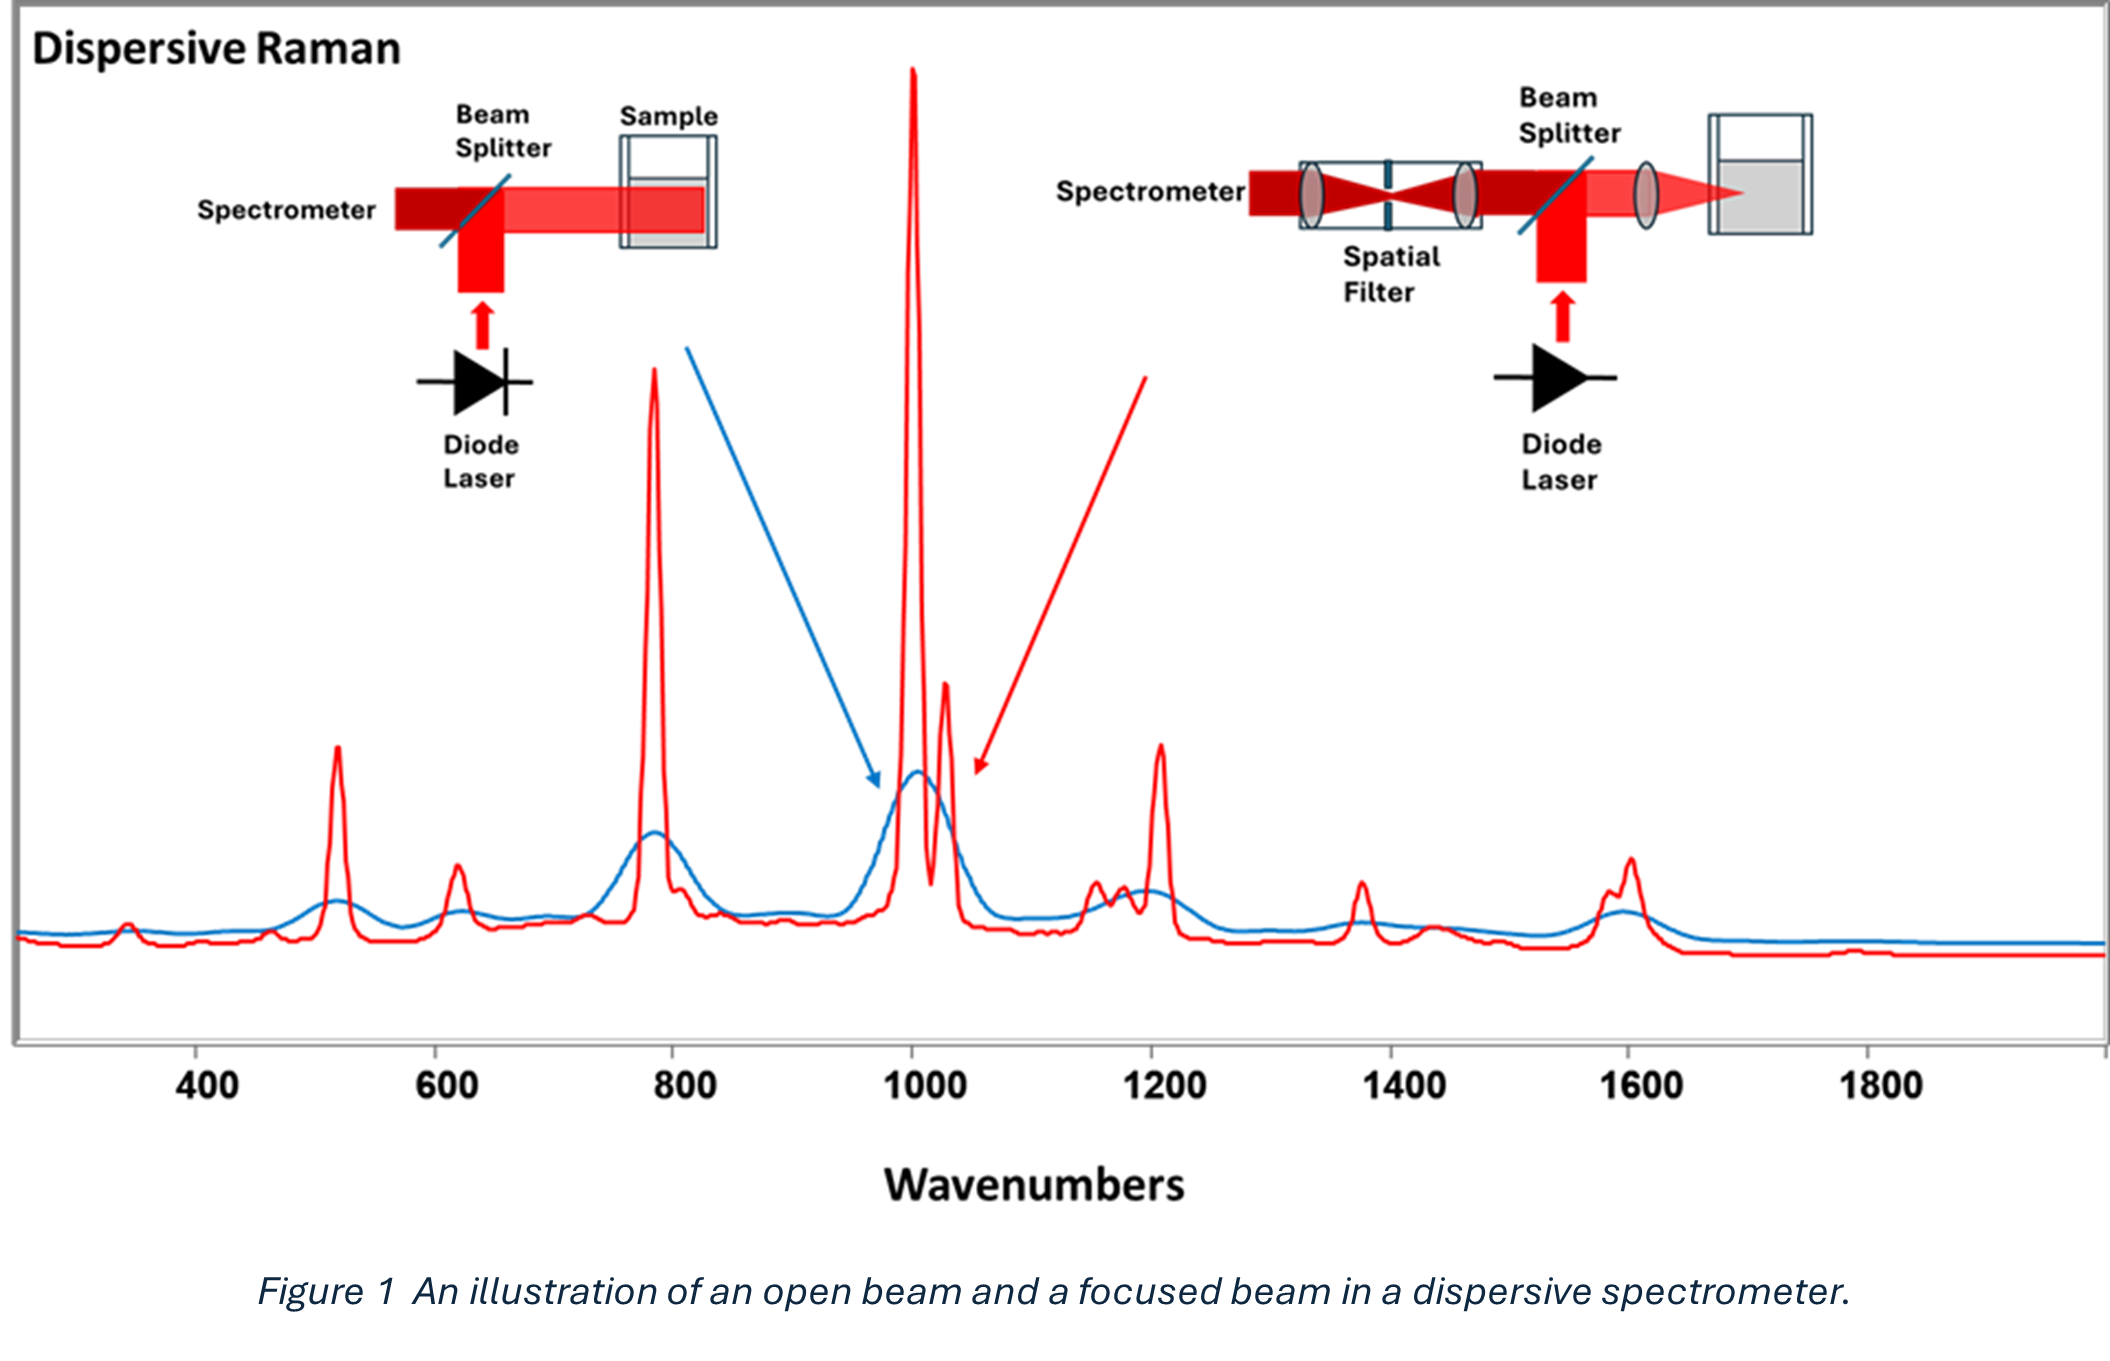
FT-Raman sampling geometry
In FT-Raman, the most practical impact is often not simply throughput, but sampling geometry. Unlike dispersive Raman systems, FT-Raman does not require a narrow spectrograph entrance slit to achieve spectral resolution. This enables the use of larger laser beam diameters at the sample while maintaining high spectral performance.
In dispersive Raman spectroscopy, a tightly focused laser spot is typically necessary to match the spectrograph aperture requirements. This improves collection efficiency but can significantly increase laser power density at the sample surface, which may be problematic for sensitive or reactive materials.
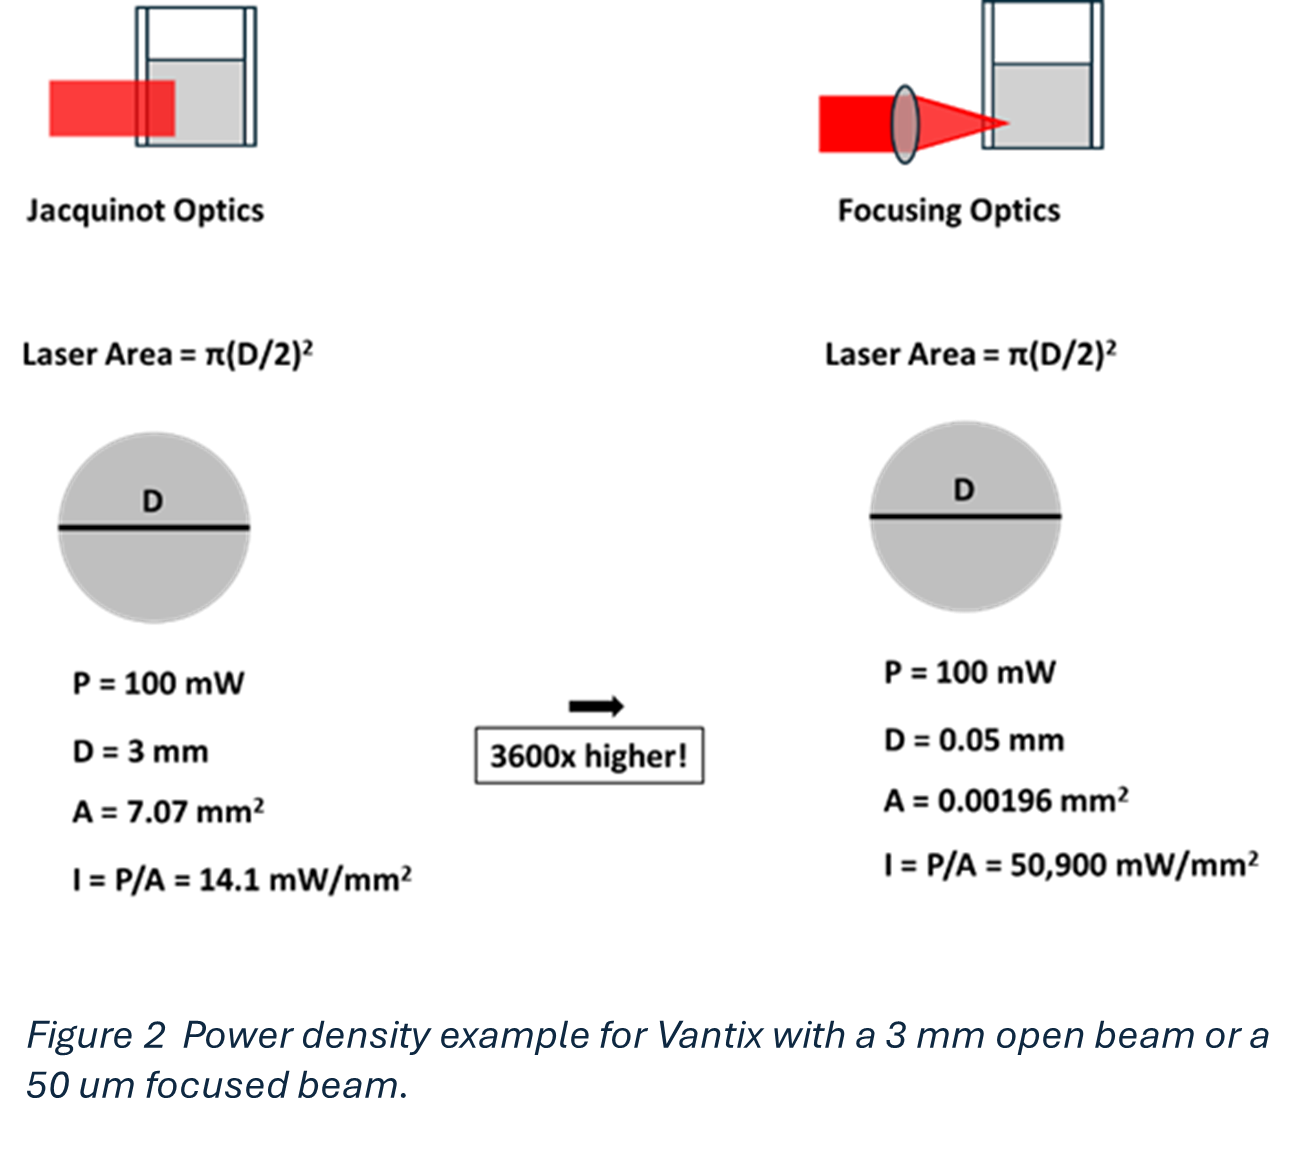
Practical Example: Power Density and Match Chemistry
Because dispersive Raman often requires a tightly focused laser spot, the resulting power density can become extremely high. In SKM’s Vantex 830 nm FT-Raman systems, users may choose either an open 3 mm beam geometry or a tightly focused configuration (e.g., ~50 µm spot).
The difference in power density is substantial (Fig. 2). A 50 µm focused spot produces approximately 3,600× higher irradiance than a 3 mm beam at the same laser power. This can be the difference between acquiring a stable Raman spectrum and unintentionally initiating photothermal or chemical reactions.
To illustrate this sampling advantage, we examined the Raman signatures of common consumer matches.
Safety Matches vs. Strike-Anywhere Matches
Matches are generally classified into two common types:
Strike-on-box (“safety”) matches, which contain no phosphorus in the match head. The reactive phosphorus compound is instead located on the striker surface, preventing ignition without deliberate striking.
Strike-anywhere matches, which incorporate a readily ignitable phosphorus compound directly in the match head and can ignite on many abrasive surfaces.
In both cases, match heads contain three essential chemical components:
an oxidizer, commonly chlorate (ClO₃⁻)
a fuel/reducing agent, often sulfur-containing materials
stabilizers and fillers, including metal sulfides and binders
Focused-Beam Measurement: Ignition Risk
We began by measuring a safety match using a focused-beam configuration. The initial Raman signal was weak, so laser power was increased to 300 mW in an attempt to improve spectral quality.
Within seconds, the match head ignited, demonstrating the practical limitation of high-power density when tightly focusing on reactive samples.
Large-Beam FT-Raman Measurement: Stable Spectra at High Power
We then repeated the measurement using a conjugate optic to produce a uniform ~3 mm beam at the sample. Under identical laser power (300 mW), the match head remained stable and no ignition occurred.
In this configuration, in Figure 3 we clearly observed the characteristic Raman features of chlorate, including the strong symmetric stretch at:
939 cm⁻¹ (ClO₃⁻ ν₁, potassium chlorate)
Additional low-frequency bands near ~350 cm⁻¹ are consistent with chlorate lattice modes and overlapping sulfide contributions from stabilizing additives.
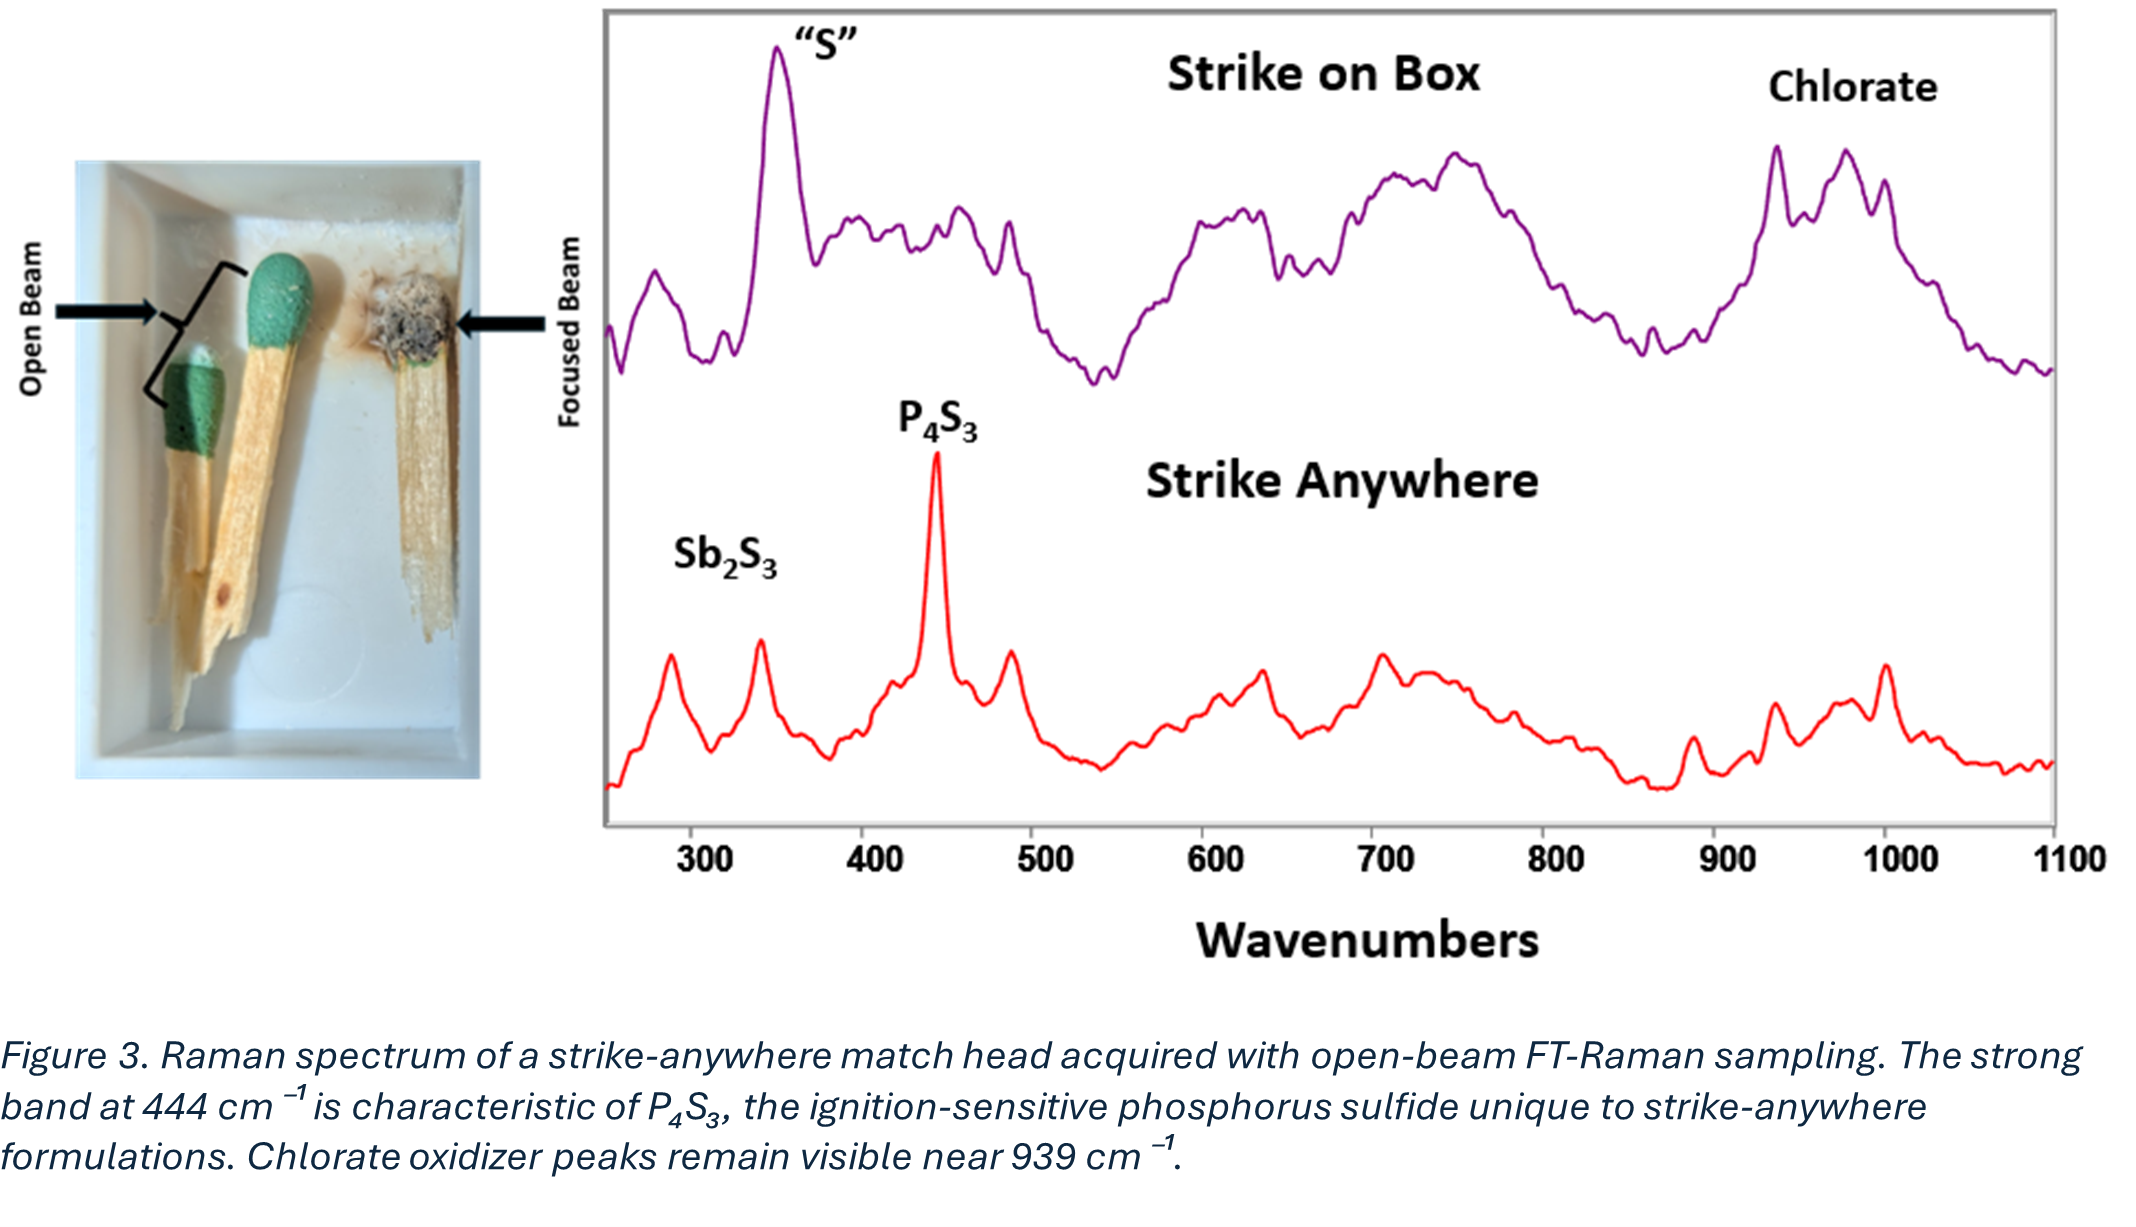
Strike-Anywhere Matches: Identification of Phosphorus Sulfides
Strike-anywhere matches were measured under the same large-beam conditions, again without ignition at 300 mW.
In this case, the spectrum revealed a distinct band at:
444 cm⁻¹, characteristic of tetraphosphorus trisulfide (P₄S₃)
P₄S₃ is the key ignition compound enabling strike-anywhere functionality and is known to ignite under mild abrasion.
The spectrum also suggests contributions from sulfur-stabilizing metal sulfides such as:
Sb₂S₃ (antimony trisulfide)
Summary: Jacquinot Advantage Enables Safer, More Flexible Sampling
FT-Raman systems can interrogate reactive or fragile samples using larger beam diameters without sacrificing spectral resolution. By reducing laser power density at the sample, SKM Instruments’ Vantix platforms provide improved robustness for challenging real-world materials, from energetic compounds to heterogeneous industrial samples.
Practical Example: Spot Size and Heterogeneous Samples
Raman spectra are often presented for pure materials. In practice, however, real-world samples are rarely pure. Illicit materials are often mixtures of drugs or explosives, and pharmaceuticals commonly contain multiple active pharmaceutical ingredients (APIs) along with fillers and excipients.
To demonstrate the sampling impact of Jacquinot geometry for heterogeneous materials, we examined an over-the-counter medicine containing multiple active components: Alka-Seltzer®, which includes citric acid, sodium bicarbonate, and aspirin. When Alka-Seltzer goes “plop plop fizz fizz” in water, the relief comes from a buffer solution created with citric acid and sodium bicarbonate to calm your stomach and aspirin to calm your headache.
Alka-Seltzer provides an excellent test case for Vantex’s Jacquinot Advantage. We offer both a focusing lens to map tablet heterogeneity and an open-beam configuration to provide bulk-averaged spectra.
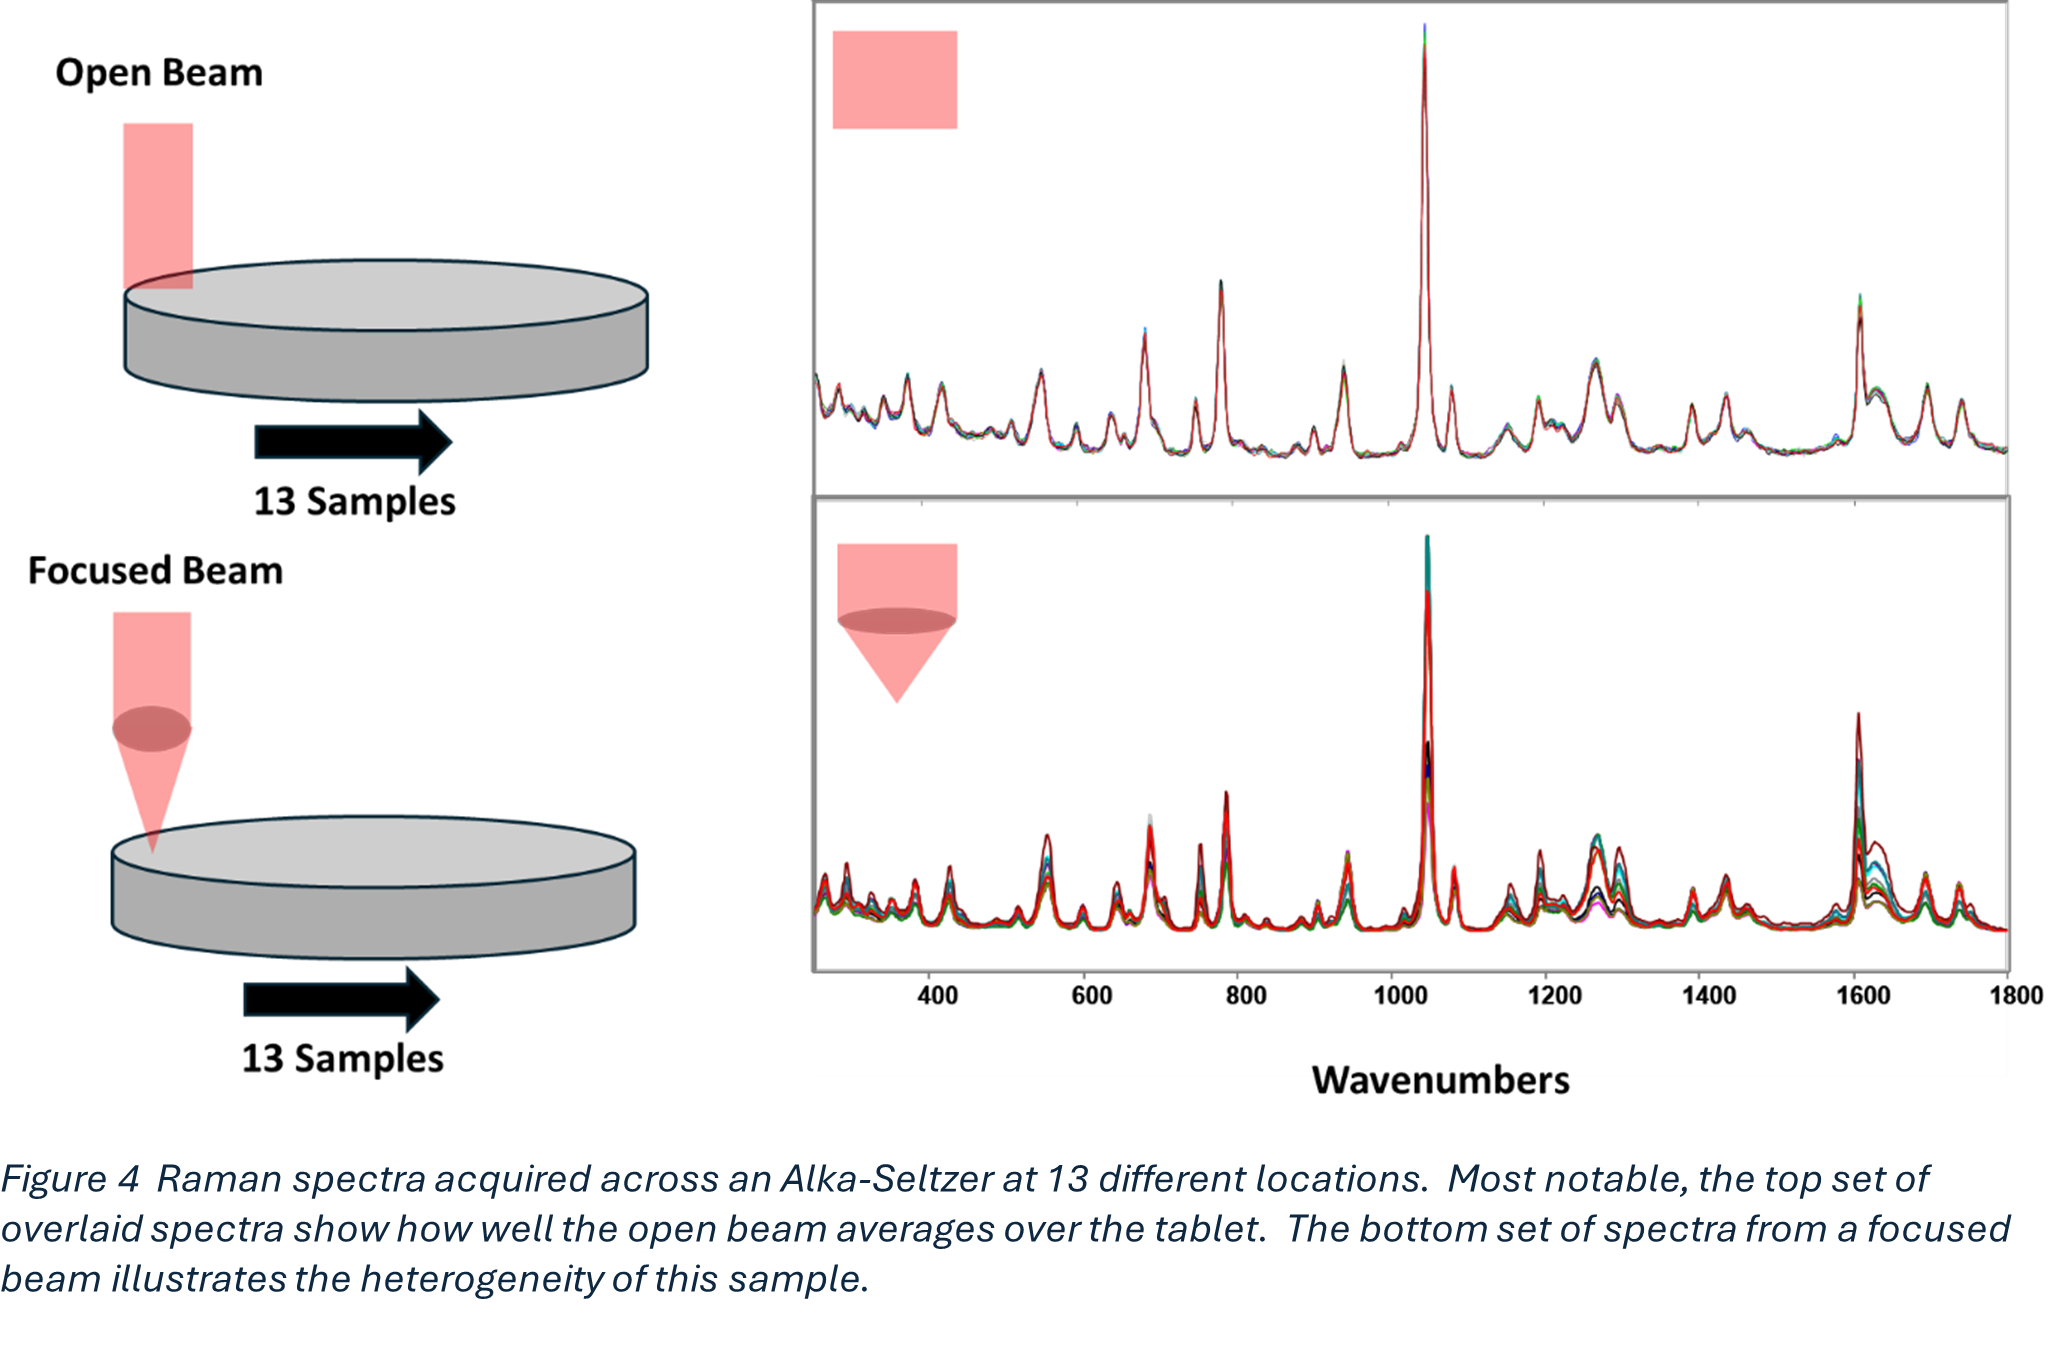
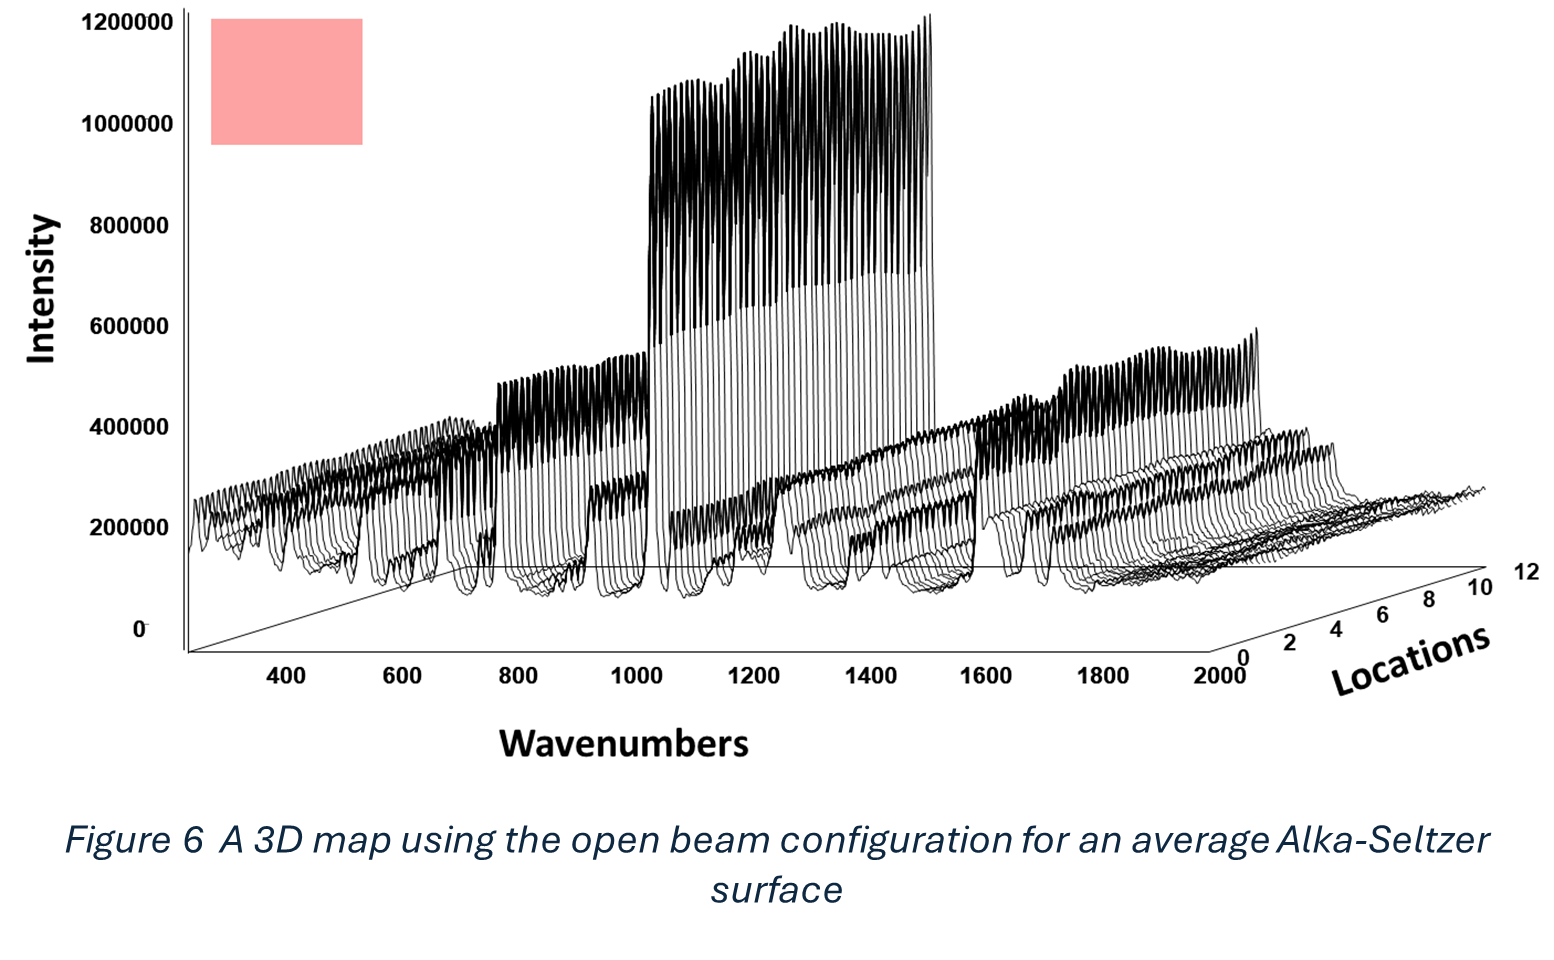
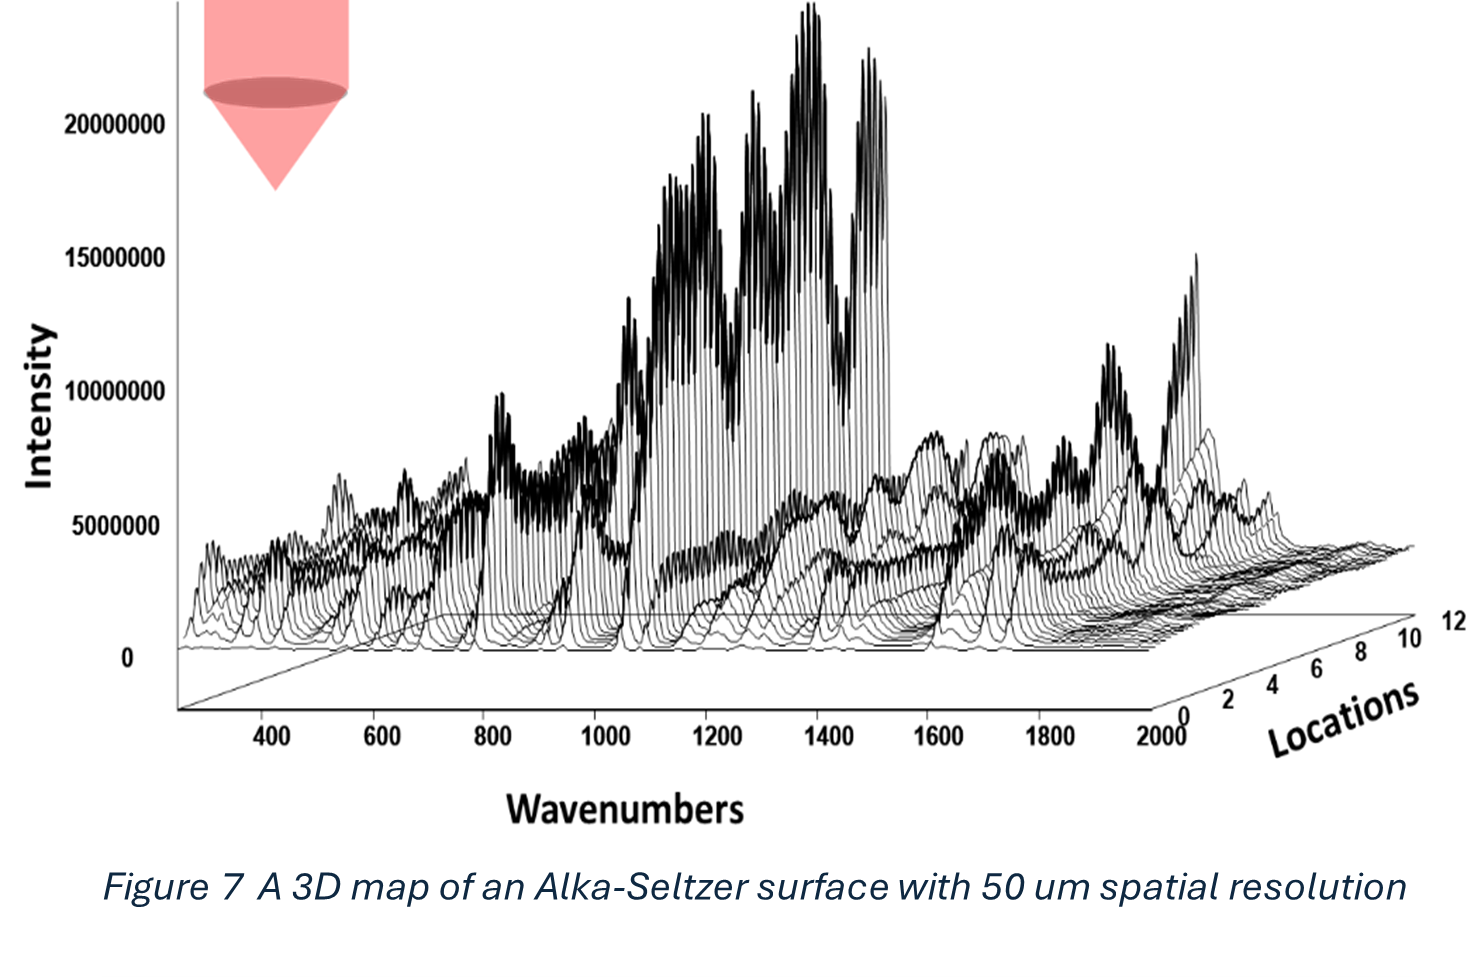
Open-Beam Averaging vs. Tight-Focus Spot Sampling
Figure 4 shows spectra collected using a large ~3 mm open-beam configuration while translating across the tablet 13 times. The resulting spectra are highly reproducible, with virtually identical intensities.
For material identification, this is ideal: a Raman library entry collected under open-beam sampling represents the entire tablet composition.
In contrast, the bottom spectrum acquired with a tightly focused ~50 µm spot varies significantly depending on sampling position and does not reliably represent the tablet as a whole.
This is the Jacquinot Advantage applied to heterogeneous sampling: large-area illumination produces stable, representative spectra, while tight focusing emphasizes local chemical variation.
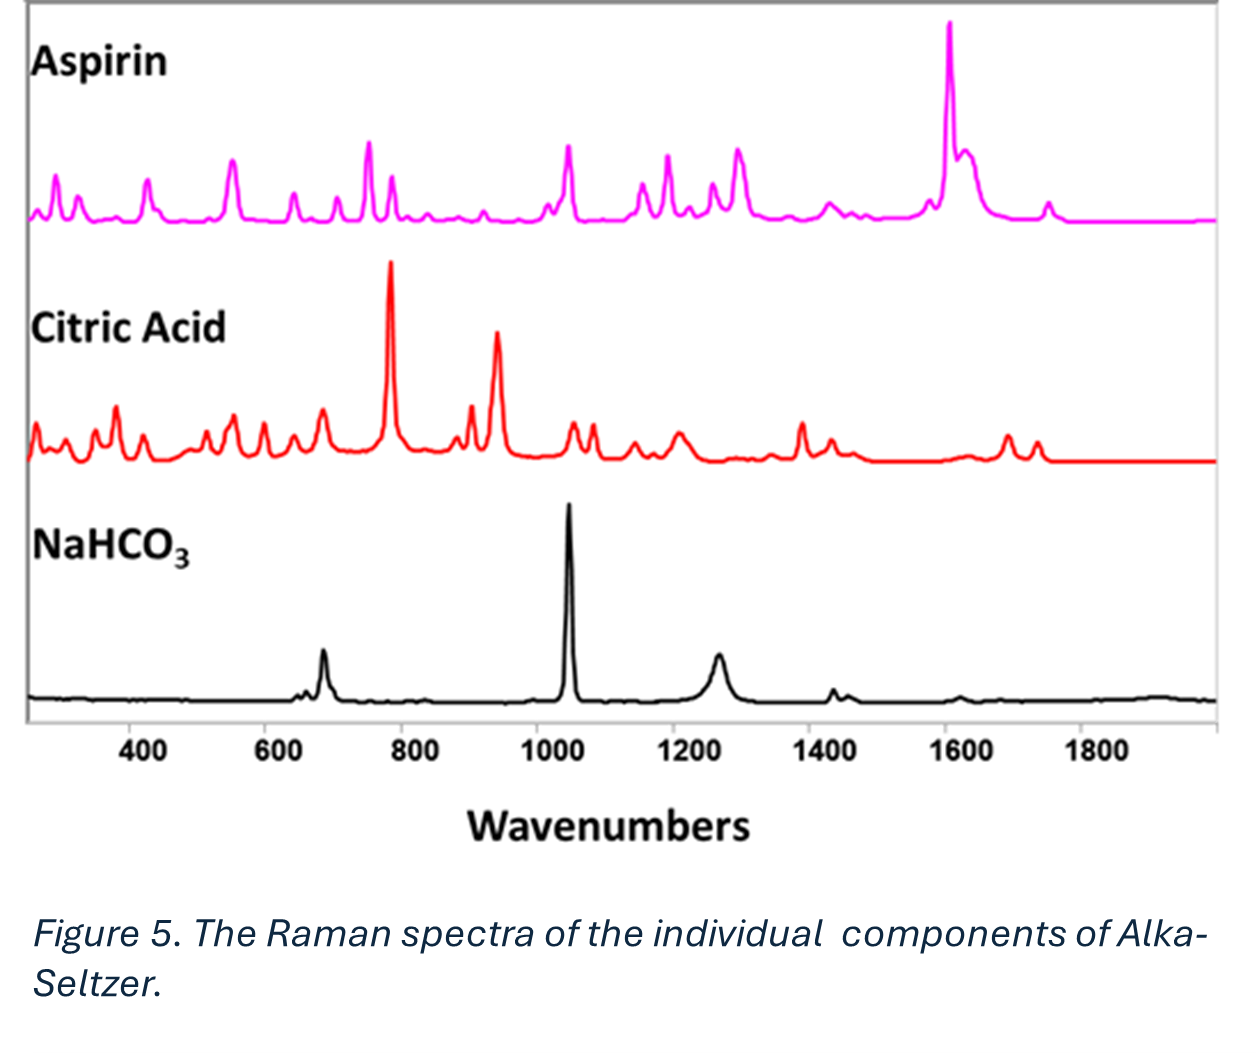
Component Spectra and Spatial Distribution
The spectra of the components of Alka-Seltzer are illustrated in Figure 5. There are unique peaks for each compound. Another way to plot this data would be a 3D plot to illustrate how the different components are located spatially as we scan across the tablet. The following two figures illustrate again the consistency of the open-beam analysis vs. the tight focus from the 50 µm spot size.
Future work could also visualize these results as a three-dimensional hyperspectral map, illustrating how different components are distributed spatially across the tablet surface.
Conclusion:
These examples highlight a practical and often underappreciated consequence of the Jacquinot Advantage in FT-Raman: the ability to decouple spectral performance from the need for extreme spatial confinement. By enabling larger illumination geometries without sacrificing resolution, FT-Raman systems such as the SKM Vantex platform can dramatically reduce laser power density at the sample, improving measurement robustness for light sensitive materials while also providing spectra that are more representative of bulk composition. In applications ranging from energetic or friction-sensitive compounds (such as match heads) to highly heterogeneous consumer products and pharmaceuticals, this sampling flexibility can determine whether a Raman measurement is stable, reproducible, and chemically meaningful.
The spatial mapping results in Figures 6 and 7 illustrate this advantage in a different way. With open-beam sampling, the Raman response represents an averaged surface composition, producing consistent spectra that align naturally with library-based identification approaches. In contrast, tightly focused measurements resolve chemical heterogeneity at high spatial resolution, revealing the distribution of individual components but at the expense of spectral variability from point to point. Together, these complementary modes demonstrate how Jacquinot-enabled FT-Raman sampling provides both safe, bulk-averaged analysis and detailed chemical localization – allowing users to choose the measurement strategy best suited to the analytical problem.
In this way, Jacquinot sampling is not only an optical throughput advantage—it is a practical pathway to safer, more reproducible, and more representative Raman spectroscopy in real-world samples.