
Vantix 1064™ SNR (I)
Winning Where Fluorescence Defeats 785 nm Raman
A Technical White Paper on Quantitative Raman Signal-to-Noise Performance
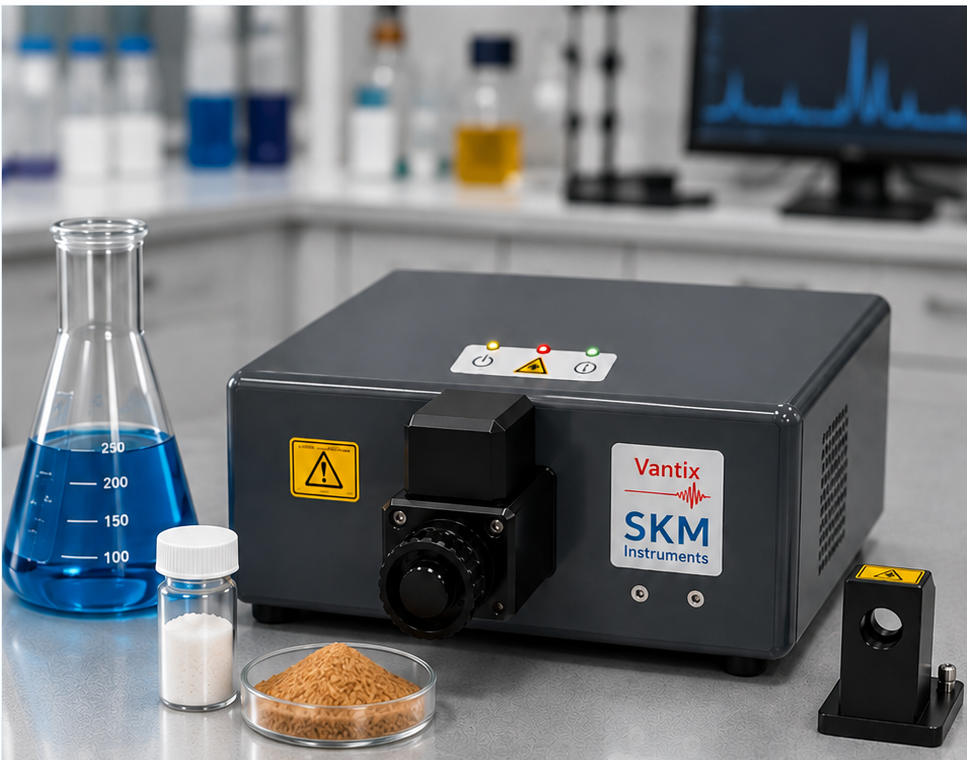
SKM’s Vantix 1064 FT-Raman instrument.
Key Takeaways
• The question this paper answers: Does 1064 nm FT-Raman sacrifice signal-to-noise performance compared with 785 nm dispersive Raman, and if so, is the trade worthwhile?
• The honest answer: On a clean, nonfluorescent sample, yes. 785 nm has a real, wavelength-based SNR advantage, and Vantix 1064 does not improve on it.
• Why Vantix wins in practice: Fluorescence can bury Raman features in optical background, consume detector dynamic range, drift with illumination, and make quantitative measurements fragile. Vantix suppresses much of that background before detection.
• The numbers, in brief: For cyclohexane, the measured 785/1064 SNR ratio is 1.85 versus the wavelength prediction of 1.84. For fluorescent brown sugar, Vantix provides about 34-fold greater Raman-to-background contrast and a highly linear Raman response (R² = 0.9966).
1. Executive Summary
Choosing between 785 nm and 1064 nm Raman is not a choice between “more Raman photons” and “fewer Raman photons.” For clean, nonfluorescent samples, 785 nm has the expected wavelength-dependent SNR advantage, and that advantage is real. The practical case for Vantix 1064 FT-Raman rests on a different fact: many real-world samples fluoresce, photobleach, or become quantitatively unstable under shorter-wavelength excitation. In those samples, the highest theoretical Raman signal does not translate into the most useful measurement.
This white paper tests that trade-off directly, using a commercial 785 nm dispersive Raman spectrometer side by side with Vantix. Cyclohexane serves as a deliberately unfavorable benchmark for Vantix, because it is essentially nonfluorescent, the sample least likely to show any 1064 nm advantage. At matched 300 mW excitation, the measured quantitative SNR ratio, SNR785/SNR1064 = 1.85, is near identical to the 1.84 ratio predicted from wavelength dependence alone. In other words, Vantix introduces no measurable quantitative SNR penalty beyond what basic physics already predicts for a longer excitation wavelength. Brown sugar shows why that trade favors Vantix in the samples customers actually care about. A local 10-point baseline analysis around the 851 cm⁻¹ band shows that the 785 nm spectrum contains a very large optical background even when replicate Raman SNR remains numerically good. At approximately 300–320 mW, the fitted local background accounts for about 97% of the integrated signal in the 851 cm⁻¹ region for the 785 nm system, compared with about 54% for Vantix. Expressed as Raman peak height divided by local background, Vantix provides approximately 34-fold greater spectral contrast at high power. The baseline-corrected Vantix Raman area also remains highly linear with excitation power (R² = 0.9966), while the 785 nm response is distinctly nonlinear and only well described empirically by a cubic fit (R² = 0.9915). The 785 nm measurements are further accompanied by measurable fluorescence photobleaching over the course of the run.
The result: a cleaner, more interpretable Raman measurement, with substantially less dependence on baseline-correction algorithms and illumination history, the difference between a spectrum you have to fight with and one you can trust.
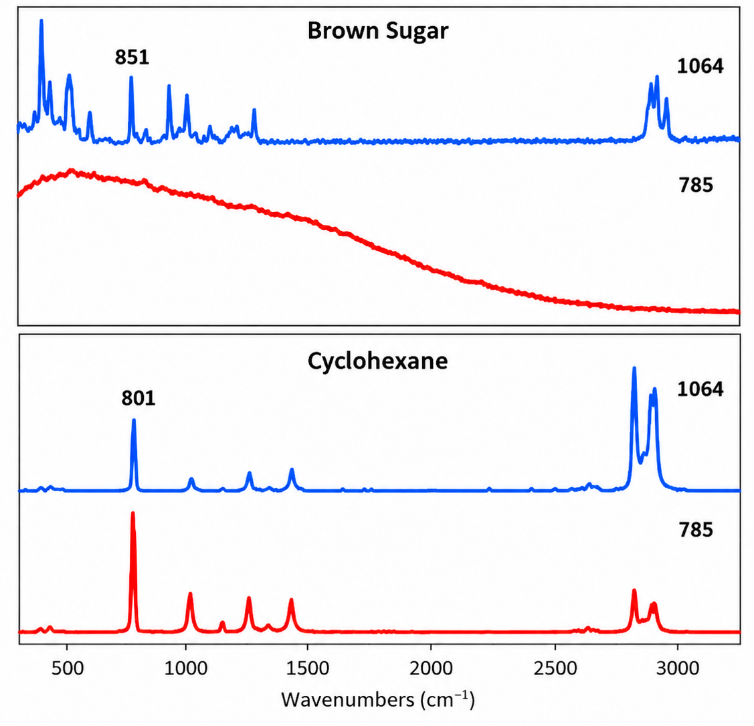
Figure 1. Representative Raman spectra of brown sugar and cyclohexane acquired with Vantix 1064 nm FT-Raman and a commercial 785 nm dispersive Raman spectrometer. Brown sugar illustrates the strong fluorescence encountered at 785 nm and its suppression at 1064 nm. Cyclohexane provides the complementary low-fluorescence benchmark used to evaluate the intrinsic wavelength-dependent SNR penalty. The labeled 851 cm⁻¹ brown-sugar and 801 cm⁻¹ cyclohexane bands were used for quantitative comparisons.
2. Why Wavelength Matters: The Physics Behind the Trade-off
Before comparing instruments, it helps to understand what the choice of excitation wavelength actually costs and buys, because the answer is different depending on whether the sample fluoresces.
2.1 The Baseline Physics: Longer Wavelengths Scatter Less
Raman scattering intensity falls off sharply as excitation wavelength increases:
Iᵣ ∝ λ⁻⁴
For otherwise equivalent measurements, the expected Raman intensity ratio between the two wavelengths used in this study is:
I₇₈₅ / I₁₀₆₄ = (1064 / 785)⁴ ≈ 3.4
Under photon shot-noise-limited conditions, the noise floor set by the quantum nature of light itself, not by instrument quality, statistical noise scales approximately as the square root of detected intensity. Consequently:
SNR ∝ (Iᵣ)0.5 ∝ λ⁻²
SNR₇₈₅ / SNR₁₀₆₄ ≈ (1064 / 785)² ≈ 1.84
What this means: the well-known 3.4-fold Raman intensity difference between 785 nm and 1064 nm translates into a smaller, roughly 1.84-fold difference in signal-to-noise. That is the price of admission for moving to 1064 nm, and it is the number this white paper tests directly in Section 3.
2.2 Why Fluorescence Changes the Calculation
Within a Raman band, the detector receives both Raman photons and fluorescence photons at the same time. The total detected intensity and its associated photon noise are:
Itotal = Iᵣ + Iꜰ
N ∝ (Iᵣ + Iꜰ)0.5
SNRᵣ ∝ Iᵣ / (Iᵣ + Iꜰ)0.5
Here is the key practical point: mathematical baseline subtraction can remove the average fluorescence background from a displayed spectrum, but it cannot remove the photon noise that fluorescence already added during acquisition. Once that noise is in the measurement, no amount of downstream processing gets it back out. Suppressing fluorescence at the point of measurement, by exciting further from the sample's electronic absorption bands, as 1064 nm typically does, reduces both the visible background and the statistical penalty that background carries with it.
This is the mechanism behind everything that follows: on a fluorescent sample, 1064 nm does more than produce a cleaner-looking spectrum. By suppressing fluorescence before detection, it reduces the background-associated noise contribution where fluorescence dominates.
3. Cyclohexane: Proving There's No Hidden Penalty
Cyclohexane is the stringent control in this study. It has minimal intrinsic fluorescence, a low spectral baseline, and a strong, well-defined ring-breathing mode near 801 cm⁻¹, in short, it is a sample that plays to 785 nm's strengths and removes the main reason anyone would choose 1064 nm. If Vantix has additional, instrument-specific SNR penalty beyond the wavelength physics described in Section 2, this is where it would show up.
At matched 300 mW excitation, 10 replicate integrated areas of the 801 cm⁻¹ band gave quantitative SNR values of 465.4 for the 785 nm dispersive system and 251.5 for Vantix. Table 1 summarizes the matched-power experiment.
| Instrument | Power (mW) | Mean area | SD | RSD (%) | Quant. SNR |
|---|---|---|---|---|---|
| 785 nm dispersive | 300 | 450,991 | 969.05 | 0.2149 | 465.4 |
| Vantix 1064 | 300 | 34,824,763 | 138,440.80 | 0.3975 | 251.5 |
Table 1. Matched-power cyclohexane quantitative peak-area results at 300 mW. SNR is the mean integrated 801 cm⁻¹ Raman peak area divided by the SD of 10 replicate peak areas. Absolute areas are instrument-specific arbitrary units and should not be compared between instruments.
The measured 785/1064 SNR ratio is 1.85, compared with the wavelength-dependent prediction of 1.84.
465.4 / 251.5 = 1.85
This is essentially identical to the 1.84 ratio predicted from wavelength dependence alone (Section 2.1). Under these low-fluorescence conditions, Vantix shows no measurable quantitative SNR penalty beyond what its longer excitation wavelength already predicts. This is the reference point against which the fluorescence-dominated brown-sugar results in Sections 4–5 should be read: any additional gap you will see there is not an artifact of the 1064 nm platform, it is the fluorescence penalty on 785 nm.
3.1 A Measurement Choice That Matters: Why Peak Area, Not Peak Height
Peak height and integrated peak area are not interchangeable measures of quantitative precision, and the choice matters for anyone building a quantitative method. In the matched 300 mW cyclohexane experiment, the 801 cm⁻¹ peak-height RSD was 0.000899 for the 785 nm dispersive system and 0.006372 for Vantix, making the Vantix peak-height reading approximately 7.09 times more variable. Peak height is particularly sensitive to spectral sampling, small shifts in peak position, instrumental line shape, resolution, and the finite sampling interval of the detector or reconstructed FT spectrum.
Integrating over the complete Raman band largely removes this sensitivity, because it captures the total detected response distributed across the peak rather than the intensity at one spectral position. For quantitative analysis, integrated peak area is therefore the appropriate metric, and it is the metric used throughout this paper. In the same 300 mW cyclohexane measurements, the 801 cm⁻¹ peak-area RSD was 0.002149 for the 785 nm system and 0.003975 for Vantix. Because quantitative SNR is the reciprocal of RSD, the corresponding SNR ratio is:
SNR₇₈₅ / SNR₁₀₆₄ = RSD₁₀₆₄ / RSD₇₈₅ = 0.003975 / 0.002149 = 1.85
This measured value is essentially identical to the theoretical wavelength-dependent prediction, (1064/785)² = 1.84. When excitation power is matched and total Raman response is evaluated correctly by integrated peak area, the observed precision difference on this low-fluorescence benchmark is fully accounted for by wavelength physics, nothing more.
4. Brown Sugar: What Happens When Fluorescence Enters the Picture
Cyclohexane showed the price of 1064 nm on an easy sample. Brown sugar shows what customers actually deal with: a fluorescence-prone sample where excitation power increases both the wanted Raman signal and, at 785 nm, a large unwanted optical background.
The 851 cm⁻¹ Raman band in brown sugar sits on top of a strong fluorescence continuum in the 785 nm dispersive spectrum. A naive peak-area calculation that integrates the total signal in that region will count a large, reproducible fluorescence contribution as if it were Raman signal, overstating how good the 785 nm measurement really is.
To isolate the true Raman contribution, each replicate spectrum was reprocessed with a local linear baseline fitted to 10 points adjacent to, but outside, the 851 cm⁻¹ band: five points on the low-wavenumber side (828–836 cm⁻¹) and five on the high-wavenumber side (864–872 cm⁻¹). The baseline-corrected Raman area was then integrated from 840 to 862 cm⁻¹, using the same procedure on both instruments. Figure 2 shows the resulting Raman area as a function of measured excitation power, normalized within each instrument to remove arbitrary intensity scaling.
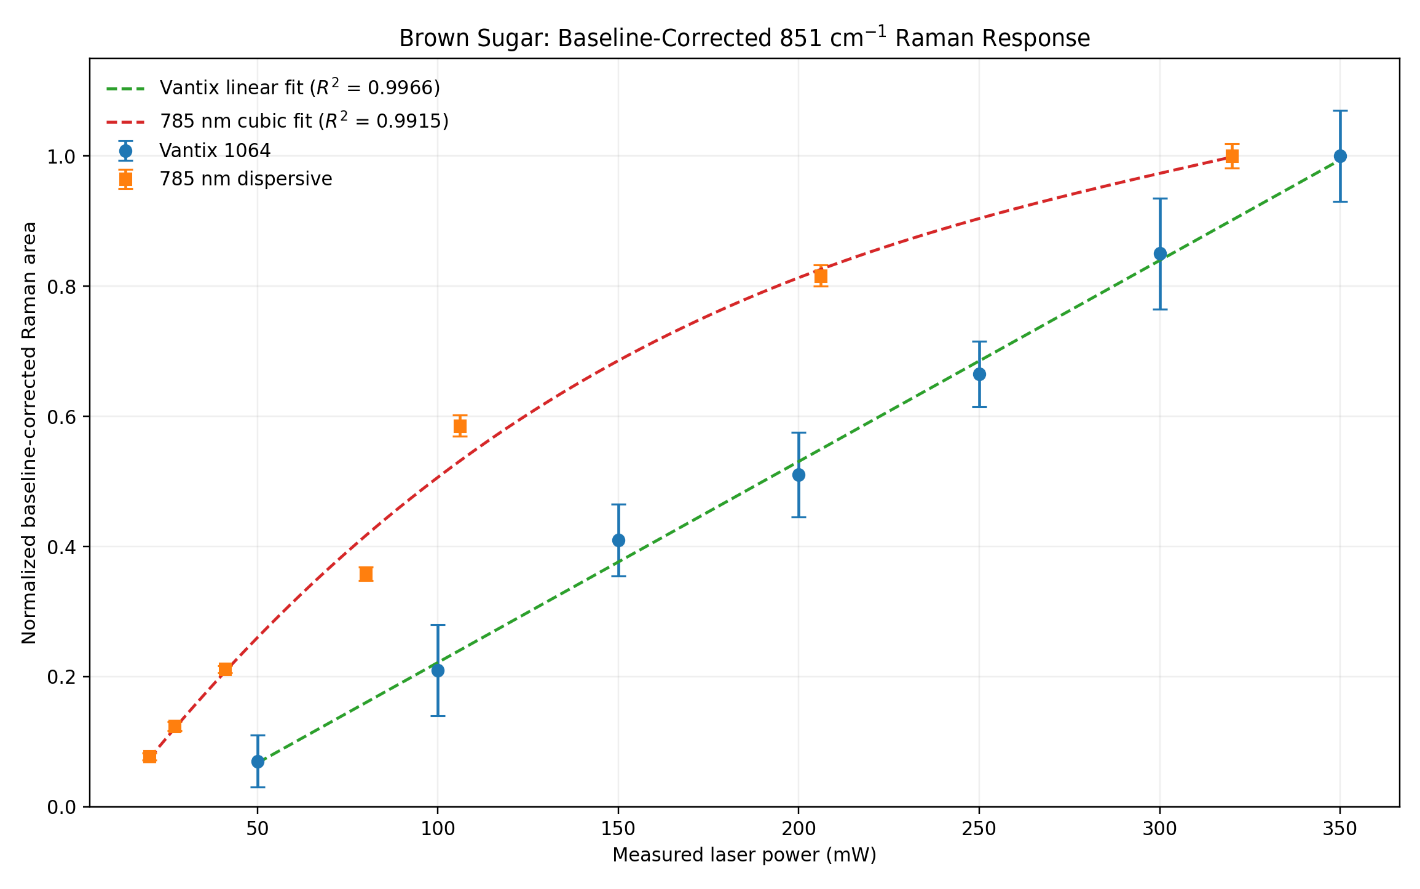
Figure 2. Baseline-corrected 851 cm⁻¹ Raman response of brown sugar versus measured laser power. For each replicate, a local linear background was fitted to 10 points adjacent to the Raman band and subtracted before integration from 840 to 862 cm⁻¹. Each instrument is normalized to its own highest mean Raman area because absolute intensity units are instrument-specific. Error bars are ±1 SD for replicate spectra. The Vantix 1064 response is strongly linear with power (R² = 0.9966). The 785 nm dispersive response is nonlinear and is described empirically by a cubic fit (R² = 0.9915); the cubic is a descriptive guide rather than a mechanistic model.
The corrected analysis reframes the comparison in an important way. The 785 nm system does retain good replicate precision after local baseline subtraction; fluorescence does not automatically make the numerical Raman SNR poor. The real penalty is structural: the Raman information rides on top of a much larger optical background. At the highest tested powers, approximately 97% of the integrated signal in the 785 nm 851 cm⁻¹ region is fitted local background, leaving only about 3% as baseline-corrected Raman area. For Vantix at 300 mW, the corresponding local background contribution is about 54%, nearly half of the integrated signal is genuine Raman signal, not background.
Why this matters operationally: a high but smooth fluorescence continuum can be subtracted mathematically, but it still consumes detector dynamic range, increases dependence on the baseline model chosen, and can change with illumination history, meaning a calibration built on one day's baseline behavior may not transfer cleanly to the next. The 785 nm brown-sugar sequence in this study also showed a small but systematic decrease in local fluorescence background across repeated measurements, consistent with photobleaching, the sample itself changing under the laser during acquisition. Vantix suppresses the fluorescence continuum at the source, so the resulting Raman spectrum requires less numerical repair before identification or quantitative analysis.
The clearest Vantix advantage, then, is spectral contrast rather than raw replicate SNR. Raman-to-local-background ratio was calculated as the baseline-corrected 851 cm⁻¹ peak height divided by the fitted local background at the peak. Near the highest tested powers, this ratio is approximately 1.59 for Vantix and 0.047 for the 785 nm system, a roughly 34-fold advantage in Raman spectral contrast. Section 5 shows that this advantage holds across the full tested power range, not just at one setting.
5. Spectral Contrast: The Metric That Actually Predicts Usability
Replicate SNR alone does not describe how difficult a Raman spectrum is to work with. For brown sugar, the 785 nm system can reproduce a small Raman band riding on a very large, slowly varying fluorescence continuum, which yields a reasonable baseline-corrected SNR number, but the analytical result depends strongly on baseline modeling and consumes far more of the detector's dynamic range than the Raman signal itself needs. Figure 3 compares Raman spectral contrast directly, using the dimensionless ratio of baseline-corrected 851 cm⁻¹ peak height to fitted local background.
In plain terms: on the 785 nm system, the Raman peak at high power is less than 5% the height of its own local background. On Vantix, the Raman peak is nearly 1.6 times taller than its local background. That is the difference between a peak an analyst, or an automated chemometric model, has to dig for, and one that stands clearly on its own.
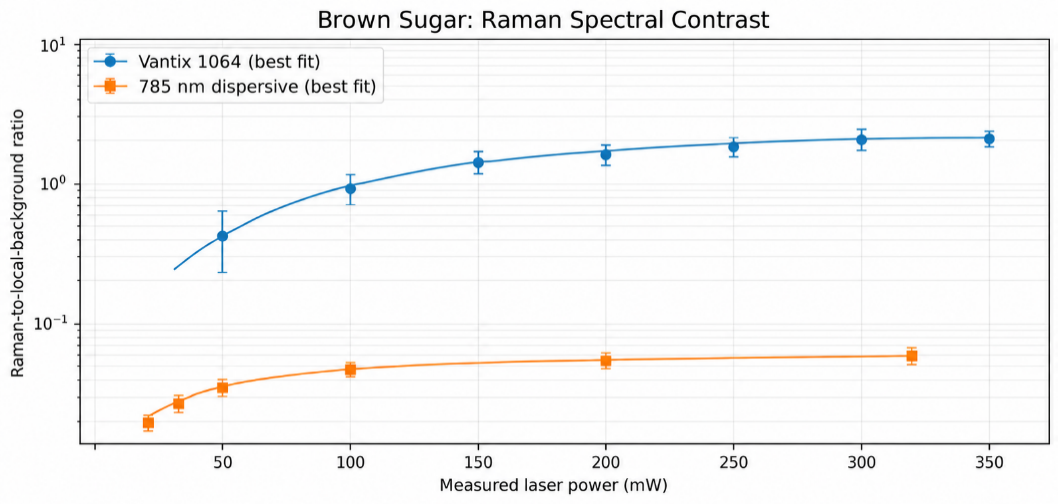
Figure 3. Raman-to-local-background ratio for the 851 cm⁻¹ brown-sugar band as a function of measured excitation power. The Raman peak height is measured after subtraction of the same 10-point local linear baseline used for Figure 2, and the denominator is the fitted local background at the Raman peak. Higher values indicate a spectrum in which Raman information occupies a larger fraction of the detected optical signal. At 300 to 320 mW, the ratio is about 1.59 for Vantix and 0.047 for the 785 nm dispersive system, giving Vantix approximately 34-fold greater Raman spectral contrast.
6. Interpretation: The Vantix Advantage
The Vantix Advantage begins with a deliberately conservative benchmark. Cyclohexane largely removes the principal reason to use 1064 nm excitation, because it is essentially nonfluorescent. In the matched-power experiment at 300 mW, the 785/Vantix quantitative SNR ratio was 1.85, essentially identical to the 1.84 wavelength-dependent prediction. This establishes the low-fluorescence reference point before considering the vastly different measurement environment created by brown-sugar fluorescence.
Section 5 exposes the aspect of performance that a simple area-based SNR metric obscures. The 785 nm instrument can measure the 851 cm⁻¹ Raman band reproducibly, but it does so while the band is buried in a fluorescence background roughly twenty times larger than the net Raman peak height at high power. Vantix reverses that balance: the net Raman peak is larger than the local background, which is a materially easier spectrum to work with for identification, chemometric modeling, weak-band detection, and quantitative method transfer between samples or instruments.
The practical importance of the Vantix Advantage, then, is not that 1064 nm must always produce a numerically higher replicate SNR, it does not, in this brown-sugar dataset. The advantage is that Vantix removes most of the unwanted optical background before it ever reaches the detector. That preserves dynamic range for real Raman features, reduces dependence on baseline-correction algorithms, minimizes fluorescence-associated shot noise and photobleaching, and makes the recorded spectrum more directly representative of the sample's actual vibrational chemistry.
The purchasing decision is therefore sample-dependent, and this paper is deliberately built to help you make it honestly:
If your samples are clean and nonfluorescent, and maximum replicate SNR is the only criterion, a shorter excitation wavelength like 785 nm retains its expected, physics-based advantage.
Vantix becomes the compelling choice when fluorescence consumes detector range, buries weak Raman features, requires aggressive baseline correction, changes with illumination history, or complicates chemometric model transfer between samples or batches.
Brown sugar is a direct demonstration of the second case: the 785 nm system gives numerically good repeatability, yet Vantix provides approximately 34 times better Raman-to-background contrast at high power, along with a more linear, more predictable baseline-corrected Raman response.
6.1 When Vantix Is the Better Raman Tool
Vantix should be considered whenever the sample, not the spectrometer, is setting the practical Raman limit. The strongest use cases are measurements where 785 nm fluorescence dominates the detected signal, consumes detector dynamic range, obscures weak Raman bands, requires aggressive or sample-dependent baseline correction, or changes during repeated illumination. Under those conditions, 1064 nm excitation simplifies the measurement at the point of acquisition, before software ever gets involved.
Brown sugar illustrates this directly: even though the 785 nm instrument retains respectable replicate SNR after baseline subtraction, Vantix delivers dramatically greater Raman spectral contrast and a much smaller background burden per measurement.
The practical Vantix proposition is straightforward: use 785 nm when your sample allows it; choose Vantix when fluorescence turns your Raman signal into a small correction on top of a large optical background. In this brown-sugar experiment, the high-power Raman-to-background ratio is approximately 34 times greater with Vantix. Cyclohexane then confirms that the cost of moving to Vantix, on an easy low-fluorescence sample, is consistent with fundamental wavelength physics, not some additional FT-Raman performance penalty.
7. Conclusions: The Vantix Advantage
In essentially nonfluorescent cyclohexane at matched 300 mW excitation, the measured 785/1064 quantitative SNR ratio of 1.85 is near identical to the predicted wavelength factor of 1.84. Vantix shows no measurable quantitative SNR penalty beyond the fundamental wavelength dependence in this dedicated benchmark.
The original, naive brown-sugar peak-area calculation overstated 785 nm Raman SNR because it included a large, reproducible fluorescence contribution in the integrated signal. Local 10-point baseline subtraction isolates the actual 851 cm⁻¹ Raman band.
After local baseline correction, the 785 nm system still retains higher replicate Raman SNR in brown sugar, but Vantix provides the more useful spectrum: at approximately 300–320 mW, Vantix has about 34-fold greater Raman-to-background contrast, and a much smaller fraction of the detected signal is non-Raman background.
The Vantix Advantage is not more Raman photons at 1064 nm. It is the ability to obtain stable, scalable, quantitative Raman measurements from samples that are fluorescent, photobleaching, or otherwise unstable under shorter-wavelength excitation, where the practical advantage of 785 nm erodes.
For difficult real-world samples, the relevant question is not "Which wavelength produces the most Raman photons?" It is "Which instrument produces the most trustworthy analytical result?" These measurements show why, when fluorescence and photobleaching become limiting, the answer is Vantix 1064 FT-Raman. A companion white paper, Vantix 1064 SNR (II), examines how quantitative signal, noise, and SNR change with the number of spectral averages, and how long-term drift and photobleaching alter the ideal √N averaging relationship.