
Vantix 1064™ SNR (II)
Why Spectral Quality Matters Beyond a Single SNR Number
Quantitative Precision, Spectral Averaging, and Fluorescence-Limited Measurements
Key Takeaways
• The question this paper answers: How does spectral averaging affect quantitative precision and spectral fidelity for 1064 nm FT-Raman compared with 785 nm dispersive Raman, and what are the practical limits?
• The main result: Averaging improves SNR while random noise dominates, but both instruments eventually reach a repeatability-limited regime where additional averaging provides little benefit and can reduce precision.
• Why 1064 nm matters: Vantix begins with a much lower fluorescence background. Computational fluorescence removal can recover Raman structure from 785 nm data, but it cannot undo the photon noise introduced when fluorescence photons were detected.
• Key numbers: For brown sugar, Vantix local baseline residual falls to about 25% of its one-average value by 50 averages, compared with about 50% for 785 nm. In the C-H region, Vantix reproduces the low-fluorescence reference with r² ≈ 0.986.
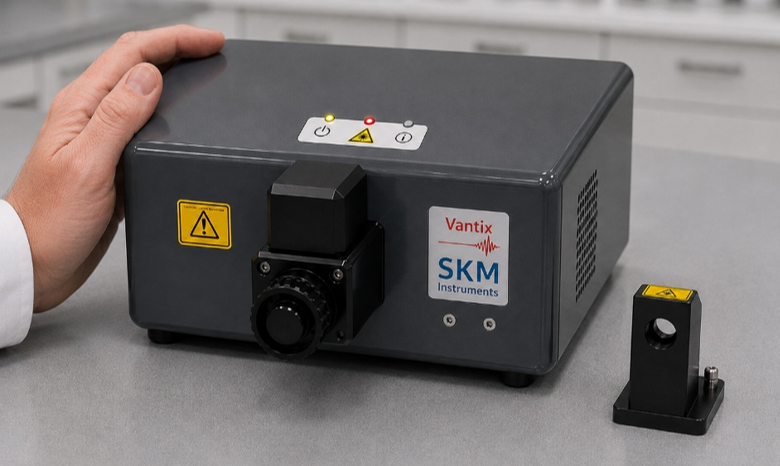
SKM’s Vantix 1064 FT-Raman instrument.
1. Executive Summary
Raman signal-to-noise ratio is often treated as a single-number measure of spectrometer performance. For quantitative process measurements, however, two different questions matter: how precisely can a Raman feature be measured, and how faithfully does the measured spectrum represent the vibrational information of the sample? Spectral averaging improves the first quantity only while random noise dominates. Fluorescence, photobleaching, baseline structure, illumination changes, and instrumental drift can impose a second, non-random limit that additional averaging cannot remove.
This companion to Vantix 1064 SNR (I) examines both aspects using cyclohexane and brown sugar measured with Vantix 1064 nm FT-Raman and a commercial 785 nm dispersive Raman spectrometer. Ten replicate spectra were acquired at 1, 10, 50, 100, 250, and 500 spectral averages. Quantitative SNR was calculated from the mean integrated Raman peak area divided by the standard deviation of replicate peak areas. Brown sugar was also used as a qualitative spectral-fidelity test because 785 nm excitation produces a large fluorescence continuum whereas 1064 nm excitation provides a low-fluorescence reference spectrum.
The measurements show three complementary results. First, brown sugar quantitative SNR initially improves strongly with averaging but ultimately reaches a repeatability-limited regime; additional averaging beyond approximately 100 to 250 averages provides little benefit and can reduce measured precision. Second, the local 785 nm baseline noise decreases much more slowly than the ideal N⁻¹ᐟ² relationship. Vantix baseline noise decreases more effectively over the initial averaging range and begins from a much cleaner optical measurement. Third, spectral correlation shows that individual Vantix spectra reproduce the low-fluorescence 1064 nm reference with very high fidelity, whereas raw 785 nm spectra are dominated by fluorescence. Computational fluorescence extraction can recover substantial Raman structure from 785 nm data, but it cannot undo photon noise generated when fluorescence photons were detected.
For process analytical technology (PAT), the quantitative conclusion is practical: the optimum number of averages is sample- and system-dependent, and averaging should be increased only while random noise remains the dominant source of uncertainty. For qualitative identification and model development, spectral fidelity is equally important. A spectrum acquired with low optical background requires less reconstruction, consumes less detector dynamic range, and provides a more direct representation of the sample composition.
2. Spectral Averaging and the √N Expectation
If successive spectra contain statistically independent random noise, averaging N spectra leaves the mean Raman signal unchanged while reducing the standard deviation of the random component by the square root of N:
σN = σ1 / √N
SNRN = SNR1 √N
A convenient empirical description is SNR ∝ Nᵅ, where α = 0.5 represents ideal random-noise-limited averaging. Real measurements also contain components that are correlated in time or systematic. A simple model is:
σtotal² = σrandom² / N + σsystematic²
At small N, the random term can dominate and averaging is effective. As N increases, the random term becomes small and the systematic term sets a floor. Longer acquisition then provides progressively less benefit. If the systematic component itself changes during the longer measurement, measured repeatability can become worse rather than better.
3. Experimental Design and Quantitative SNR
Two samples were used. Cyclohexane provides a low-fluorescence control with a strong 801 cm⁻¹ Raman band. Brown sugar provides a fluorescence-prone sample with an 851 cm⁻¹ Raman feature and strong C-H stretching structure. For each instrument and sample, 10 replicate measurements were evaluated at 1, 10, 50, 100, 250, and 500 spectral averages.
Quantitative SNR was defined as the reproducibility of integrated Raman response across replicate measurements:
Quantitative SNR = mean integrated Raman peak area / SD of replicate peak areas
This definition is intentionally appropriate for quantitative and process applications. It measures how precisely an integrated Raman response can be reproduced rather than how visually prominent a peak appears in a single spectrum. For brown sugar, the 851 cm⁻¹ response was evaluated with the same local 10-point baseline approach used in SNR (I), with baseline points on either side of the Raman band and integration from 840 to 862 cm⁻¹.
4. Brown Sugar: Quantitative SNR as a Function of Averaging
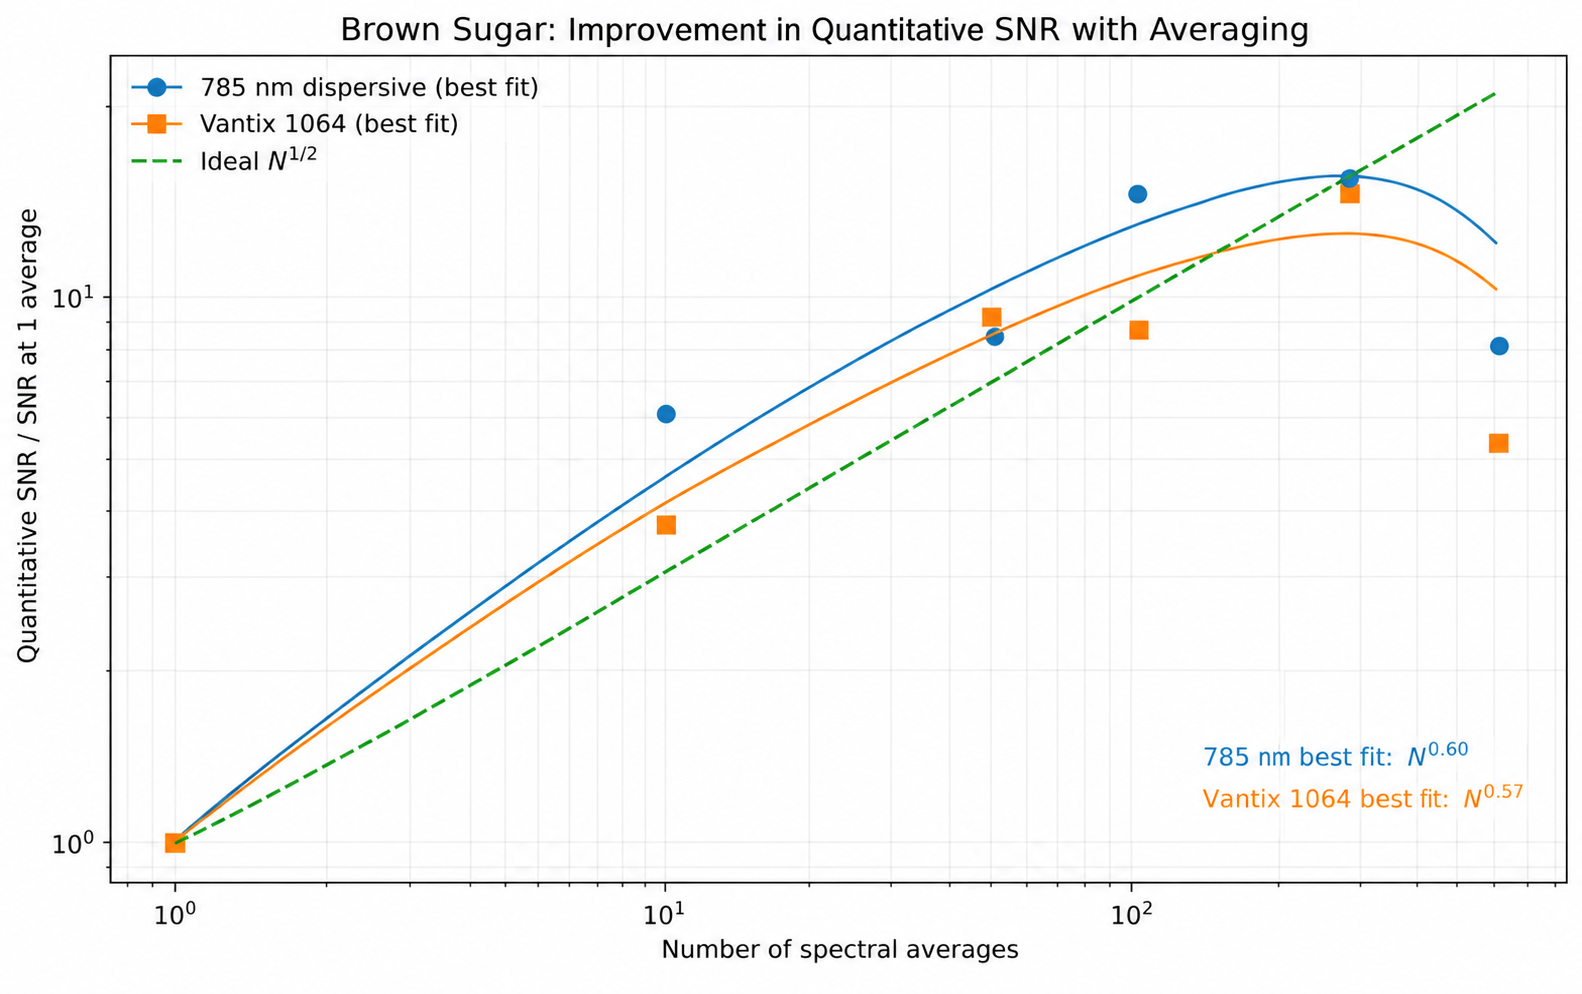
Figure 1. Brown sugar quantitative SNR normalized to the SNR measured at one average. The dashed relationship represents ideal √N improvement. Both instruments initially gain substantially from averaging, but neither continues to follow the ideal relationship at high N. The result identifies a transition from a random-noise-dominated regime to a repeatability-limited regime.
The initial brown sugar behavior is close to the expected random-noise trend. Over 1 to 50 averages, the empirical SNR exponents are approximately 0.57 for both instruments in the original analysis. The similarity is important: spectral averaging is operating on both measurements, and neither instrument has a unique exemption from the statistics of averaging.
At higher N, the behavior changes. The 785 nm quantitative SNR reaches its best measured value near 250 averages and then decreases at 500 averages. Vantix shows the same general transition, with the best measured value near 250 averages followed by deterioration at 500. The precise optimum should not be interpreted as a universal setting. It reflects this sample, these instruments, and the time scale of the experiment. The important result is that more averages do not necessarily produce a more precise quantitative measurement once non-random variation becomes important.
4.1 Implications for Process Measurements
For PAT and other quantitative applications, the useful output is not simply the smoothest-looking spectrum. A process model depends on repeatable analytical variables such as integrated band areas, band ratios, or multivariate scores. Averaging should therefore be selected from the observed precision of the analytical variable. Increasing N is beneficial while replicate uncertainty decreases approximately as expected; after a repeatability floor is reached, additional averaging increases measurement time without proportional analytical benefit and can make the measurement more vulnerable to process drift.
The data suggest a practical optimization procedure: determine quantitative SNR or RSD as a function of averaging on representative process samples, identify the onset of the plateau, and select an averaging level near that transition rather than automatically maximizing N. This preserves temporal response while capturing most of the available random-noise reduction.
5. Baseline Noise: Where Averaging Stops Behaving Ideally
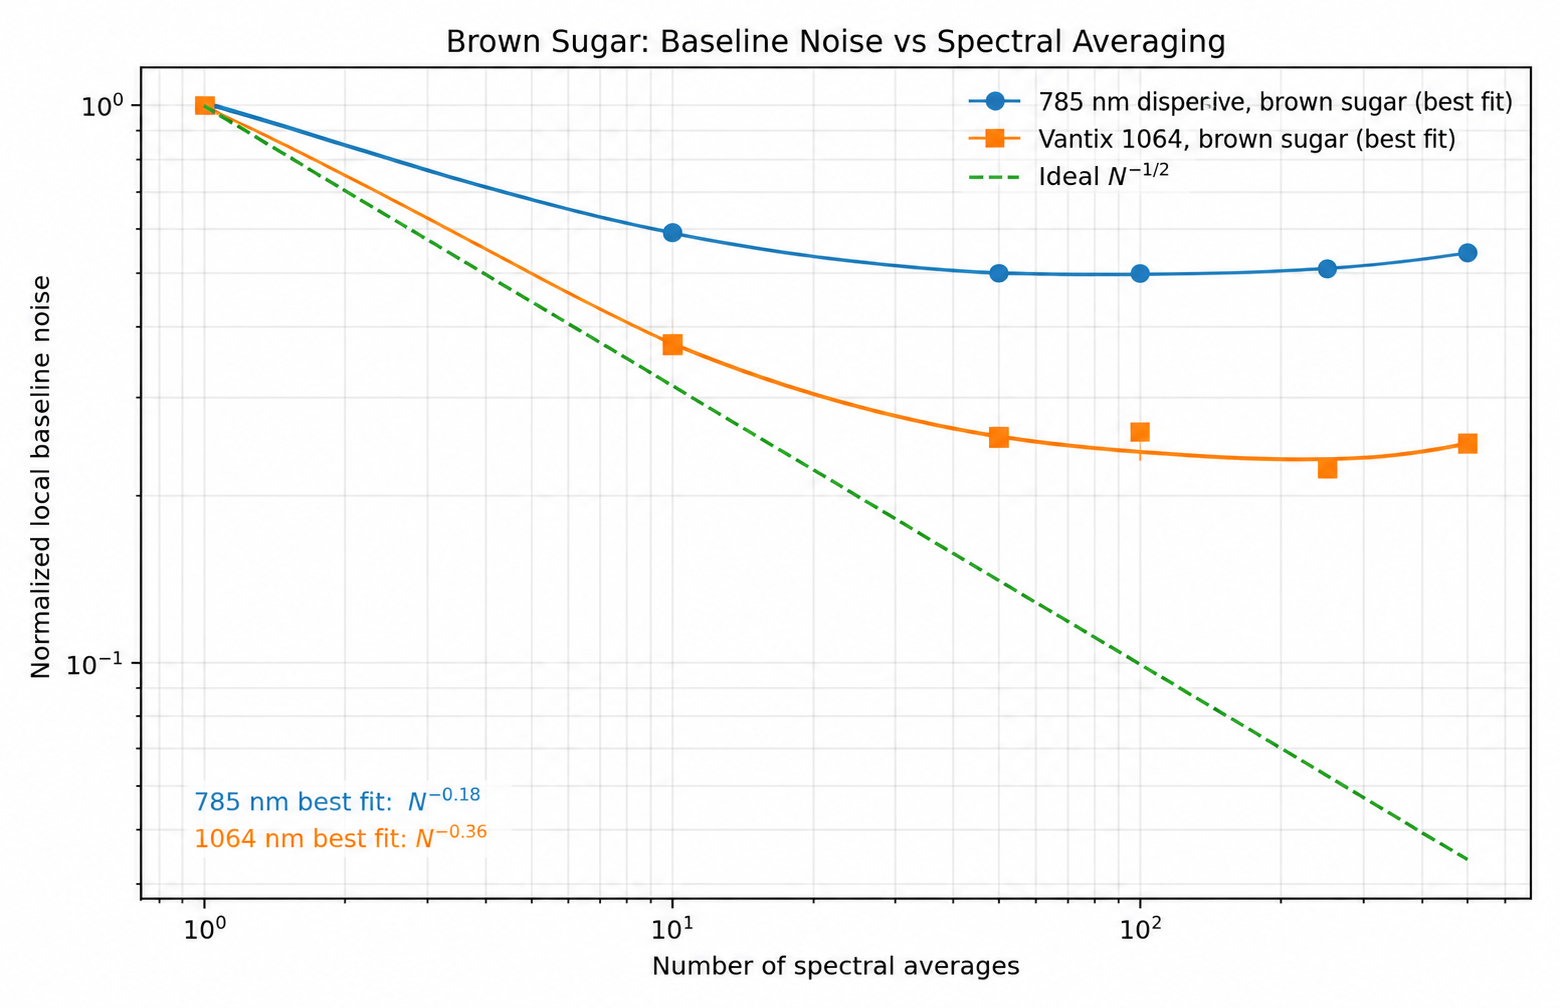
Figure 2. Brown sugar local baseline residual noise normalized to the one-average value for each instrument. The dashed line shows ideal N⁻¹ᐟ² behavior. Absolute detector units are not compared across instruments; each curve is normalized to its own one-average measurement.
Figure 2 exposes information that a single peak-area SNR does not. By 50 averages, the Vantix local baseline residual has fallen to approximately 25% of its one-average value, a fourfold reduction. The 785 nm residual remains at approximately 50%, only a twofold reduction. Over 1 to 50 averages, the corresponding noise-reduction exponents are approximately 0.36 for Vantix and 0.18 for the 785 nm system, compared with the ideal value of 0.5.
Neither curve should be interpreted as a pure measurement of photon shot noise. The local residual can contain Raman-independent spectral curvature, fluorescence changes, detector effects, illumination variation, and slow drift. That limitation is itself relevant. Averaging is highly effective against independent random fluctuations but much less effective against structured or slowly varying background. Vantix begins with substantially less fluorescence, so averaging operates on a cleaner optical measurement. The high fluorescence background of 785 nm Raman with brown sugar will lead to strong dependence on the laser stability and may account for it less ideal behavior.
| Averages | 785 normalized baseline RMS | Vantix normalized baseline RMS | Ideal N⁻¹ᐟ² |
|---|---|---|---|
| 1 | 1.000 | 1.000 | 1.000 |
| 10 | 0.594 | 0.370 | 0.316 |
| 50 | 0.502 | 0.253 | 0.141 |
| 100 | 0.506 | 0.269 | 0.100 |
| 250 | 0.511 | 0.225 | 0.063 |
| 500 | 0.546 | 0.248 | 0.045 |
6. Qualitative Spectral Quality: What Do the Spectra Actually Look Like?
The full-range spectra illustrate why quantitative precision and spectral quality should be considered separately. Averaging makes both measurements smoother, but it does not remove the large fluorescence continuum present at 785 nm. The broad C-H region is particularly informative because it contains chemically useful hydrocarbon structure while also exposing the effect of the 785 nm background. At 1064 nm the vibrational structure is observed on a much lower optical background.
This distinction is important for qualitative identification, library matching, chemometric model transfer, and heterogeneous samples. A reproducible background can still yield good replicate statistics for a selected band, yet the measured spectrum may remain highly dependent on baseline modeling and preprocessing. Spectral quality therefore includes both precision and fidelity.
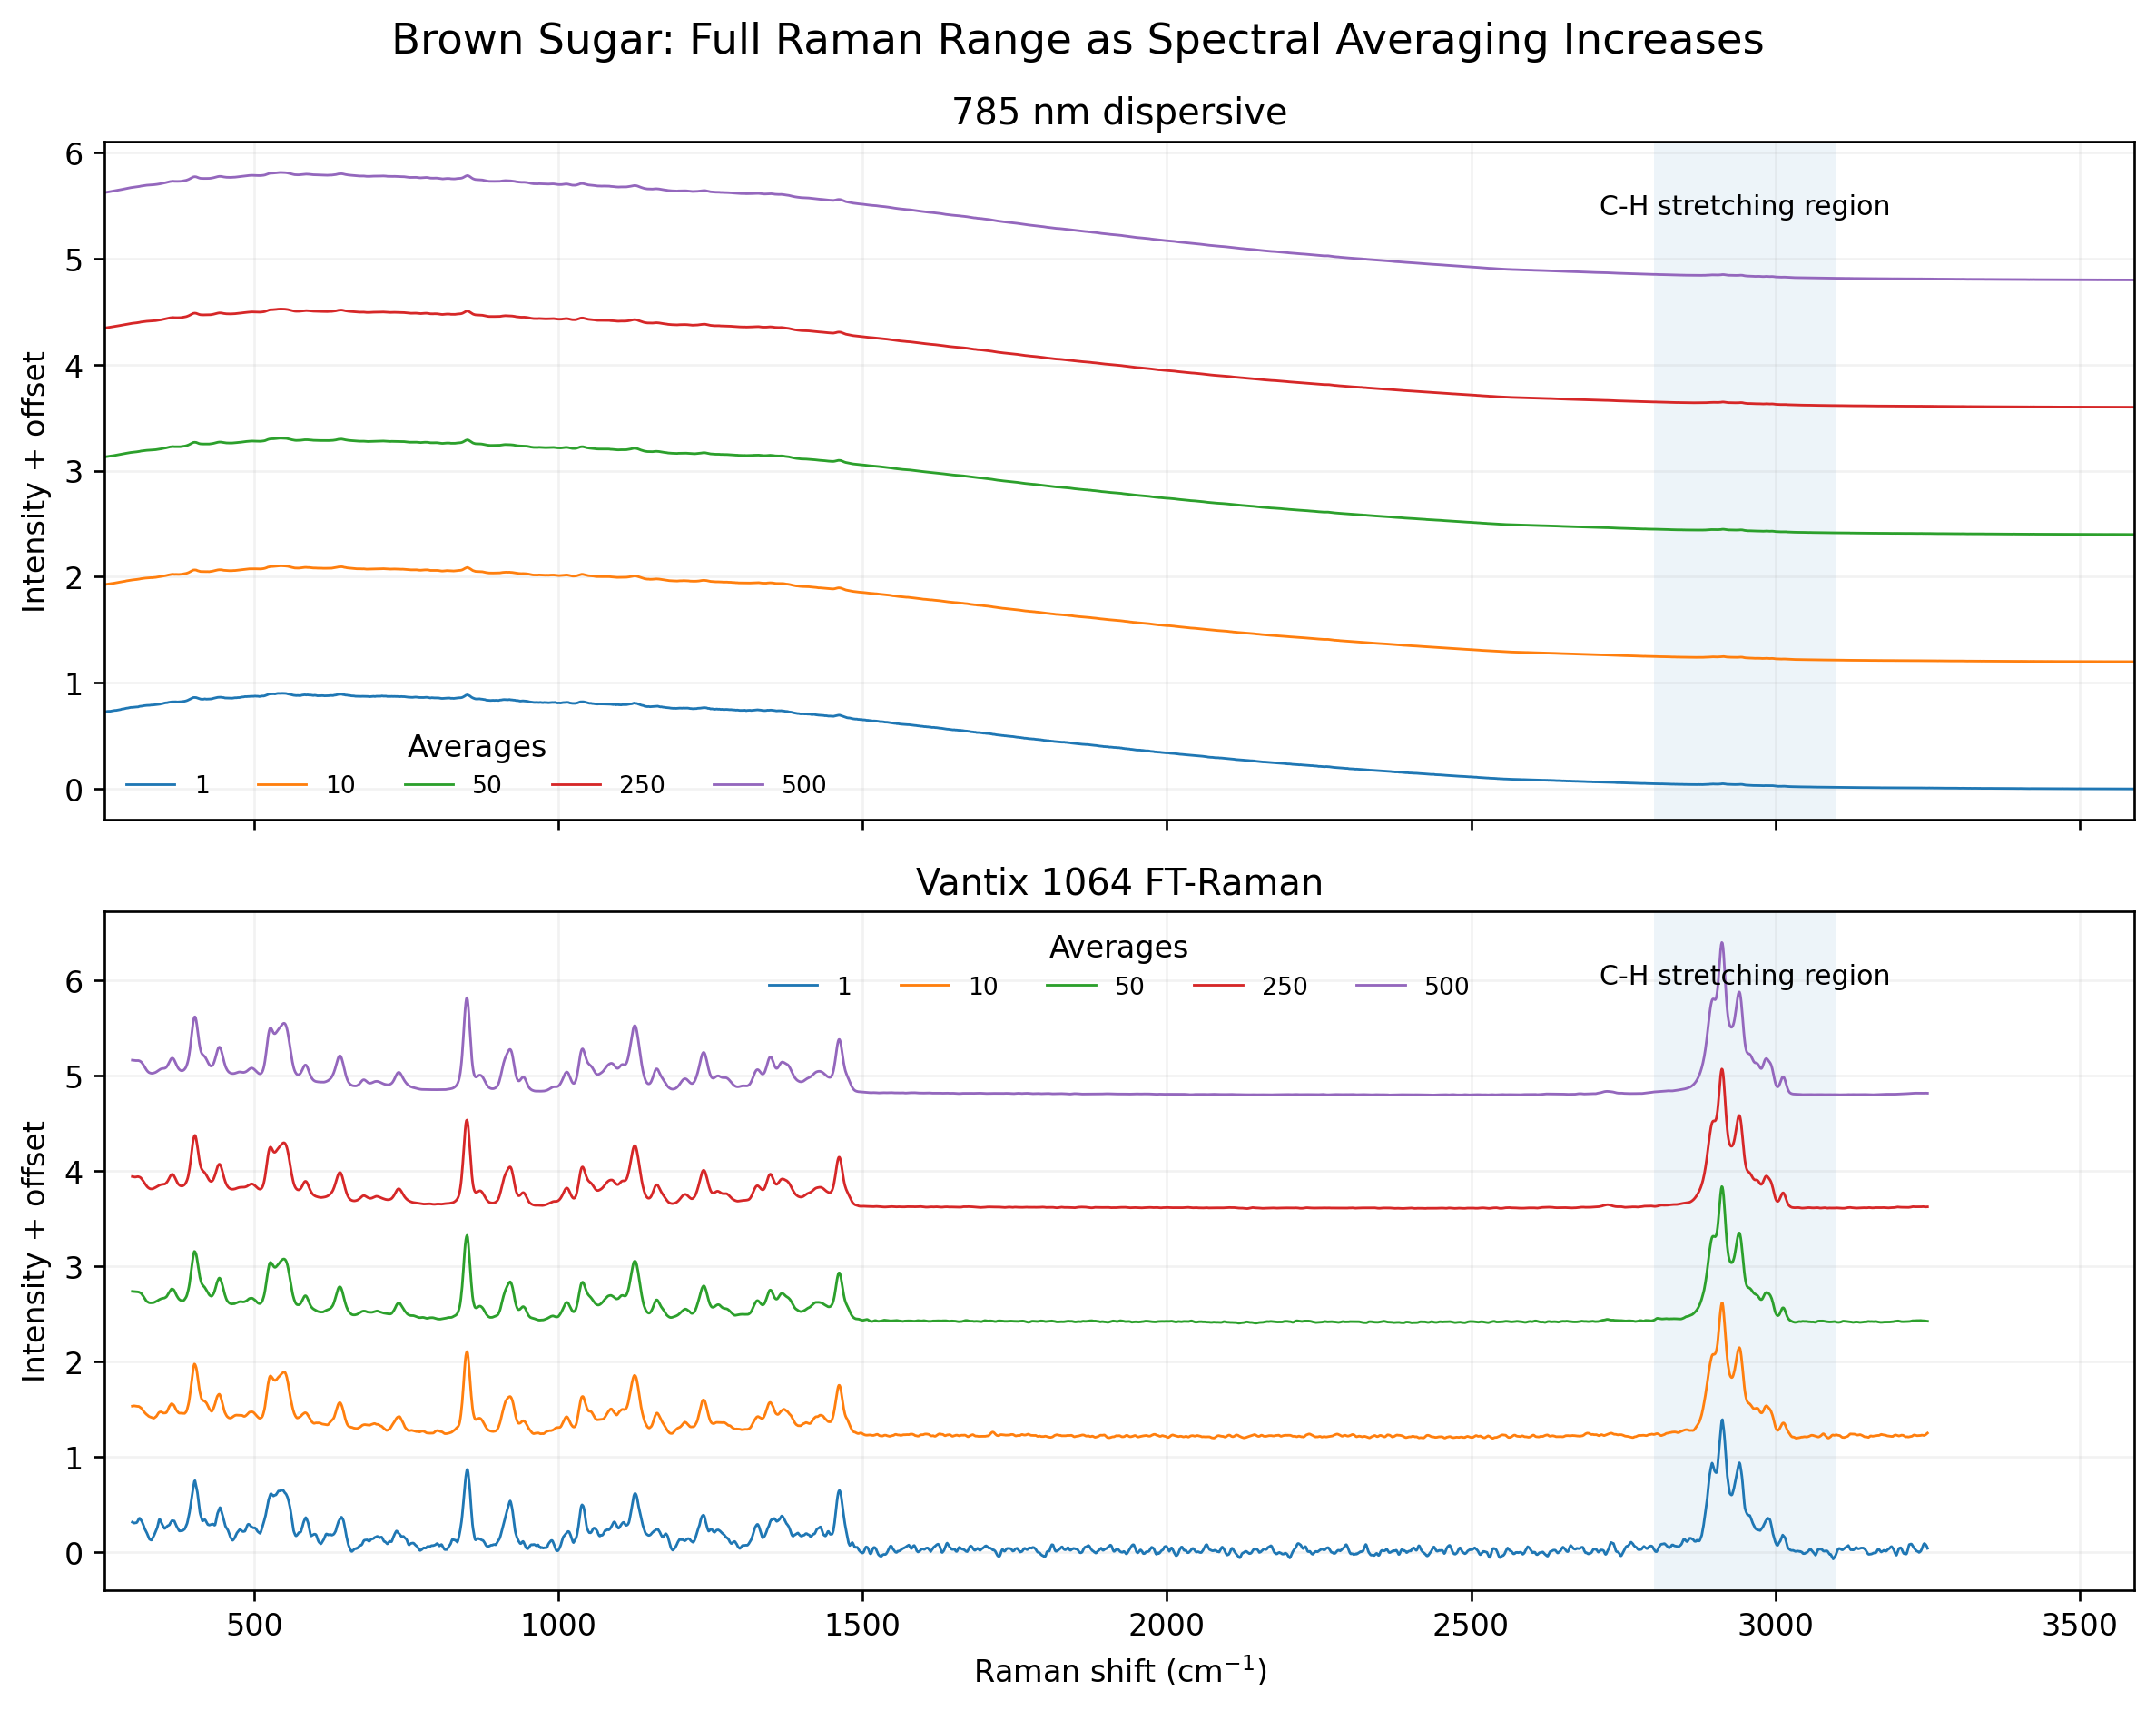
Figure 3. Mean brown sugar spectra at 1, 10, 50, 250, and 500 averages for the commercial 785 nm dispersive system and Vantix 1064 nm FT-Raman. A single affine scaling is used within each instrument and traces are vertically offset for visibility. The full spectral range is shown to include the C-H stretching region near 2800 to 3100 cm⁻¹.
7. Spectral Fidelity and Simulated-Shift Fluorescence Extraction
Quantitative SNR describes measurement precision, but spectral fidelity asks a different question: how closely does the measured spectrum reproduce the vibrational structure of the sample? For spectral identification we express similarity as the coefficient of determination, r², rather than signed Pearson r. Squaring the correlation places the spectral-match scale from 0 for no correlation to 1 for perfect correlation and removes the sign of r, which is not useful for the present identification comparison because the relevant outcome is the degree of positive spectral agreement. Brown sugar provides a stringent test because 785 nm excitation produces a large fluorescence continuum, whereas 1064 nm excitation provides a substantially lower-fluorescence spectrum. The mean Vantix 1064 spectrum was therefore used as the low-fluorescence spectral reference for Figure 4.
We refer to this processing descriptively as simulated-shift fluorescence extraction (SSFE). It is an experimental method used here to test how effectively computational background removal can recover Raman structure from a fluorescence-dominated spectrum.
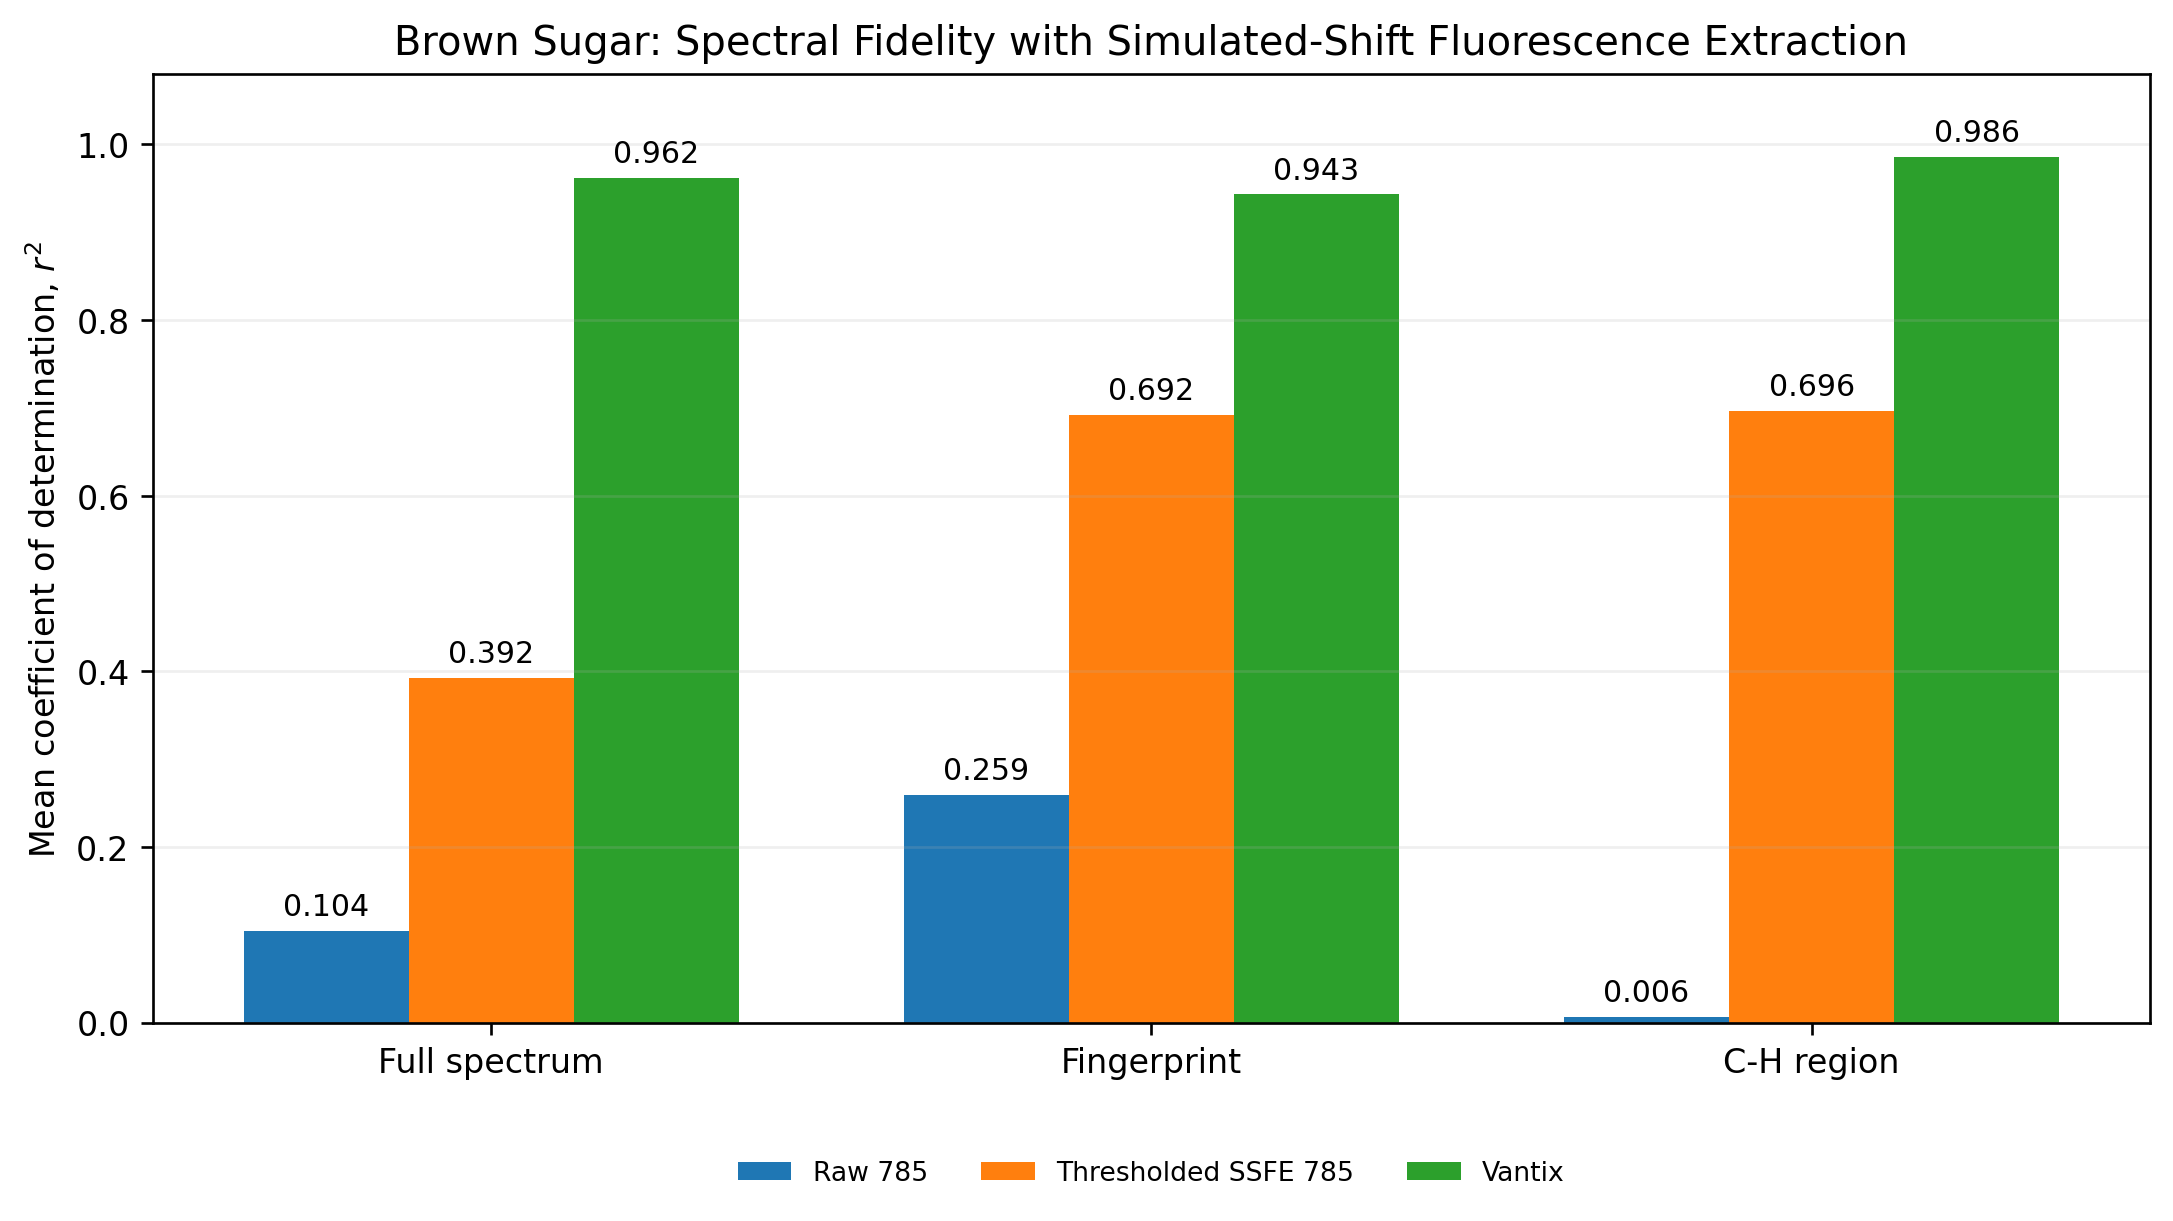
Figure 4. Mean coefficient of determination (r²) for brown sugar relative to the low-fluorescence 1064 nm reference. Raw 785 nm spectra are compared with the same spectra after thresholded SSFE processing and with individual Vantix 1064 spectra. Vantix values use a leave-one-out 1064 nm reference to avoid comparing a spectrum with an average containing itself. The coefficient of determination is calculated here as the square of the Pearson correlation coefficient.
8. What the Coefficient of Determination Shows
Figure 4 shows that the raw 785 nm spectrum has a low coefficient of determination with the low-fluorescence 1064 reference over the full spectrum (r² = 0.104), while SSFE processing increases r² to 0.392. In the fingerprint region, r² improves from 0.259 to 0.692. The most striking result occurs in the C-H stretching region, where the raw 785 nm value is only 0.006 but increases to 0.696 after SSFE extraction. These changes demonstrate that substantial Raman information is present beneath the 785 nm fluorescence background and can be computationally recovered.
The spectral comparison in Figure 5 makes the same result visible directly. SSFE processing removes much of the broad 785 nm background and recovers many of the Raman features seen with 1064 nm excitation. Nevertheless, the individual Vantix spectra remain much closer to the low-fluorescence reference: r² = 0.962 for the full spectrum, 0.943 for the fingerprint region, and 0.986 for the C-H region. The comparison is not intended to attribute every inter-instrument difference exclusively to fluorescence since the instruments also differ in optical architecture, resolution, spectral response, and sampling. Rather, it distinguishes computational recovery of Raman structure from direct acquisition of a low-background spectrum. This distinction leads directly to the SNR question examined next: computational processing can remove much of the mean fluorescence background from the displayed spectrum, but can it also restore the ideal √N improvement expected when independent random noise dominates?
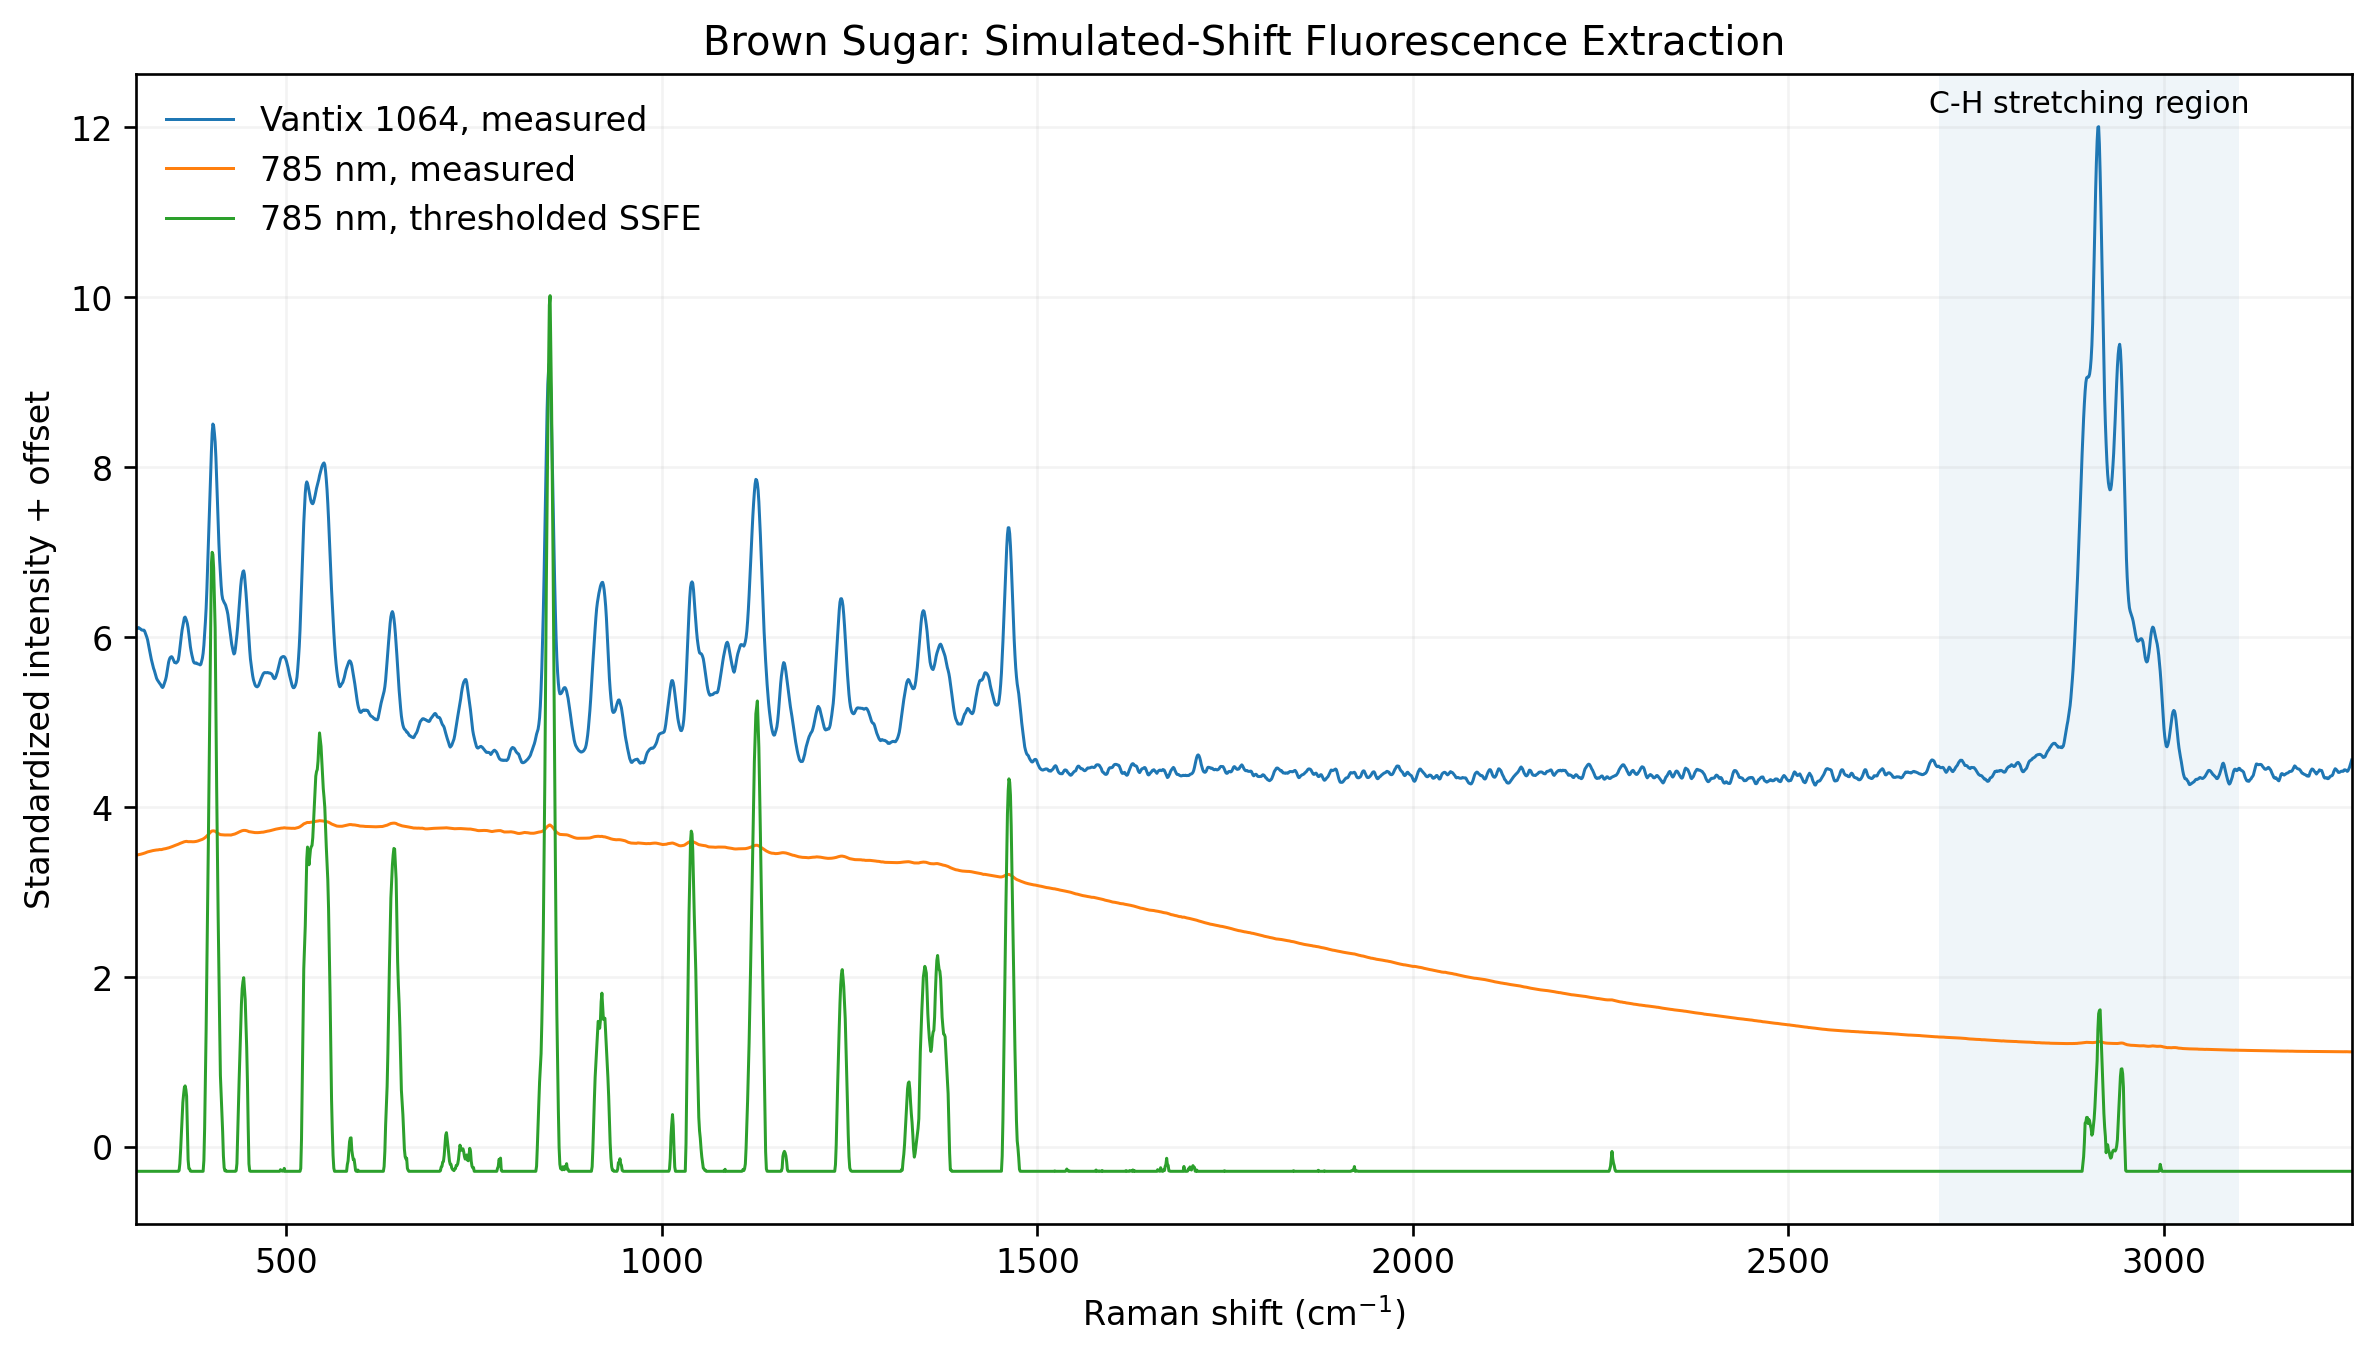
Figure 5. Brown sugar spectra illustrating the coefficient-of-determination result in Figure 4: measured Vantix 1064 nm, raw 785 nm, and thresholded SSFE extraction from the 785 nm measurement. The SSFE spectrum is an experimental single-spectrum simulated-shift extraction.
9. Does Computational Extraction Restore √N Averaging?
The extraction improves quantitative SNR modestly at several averaging levels, but it does not restore indefinite √N behavior. Over the initial 1 to 50 average range, the fitted exponents are approximately 0.610 for raw 785 nm data and 0.604 after SSFE processing. The near equality is the key observation: computational removal of the mean fluorescence background changes the extracted spectrum, but it does not fundamentally change how the measurement precision scales with averaging.
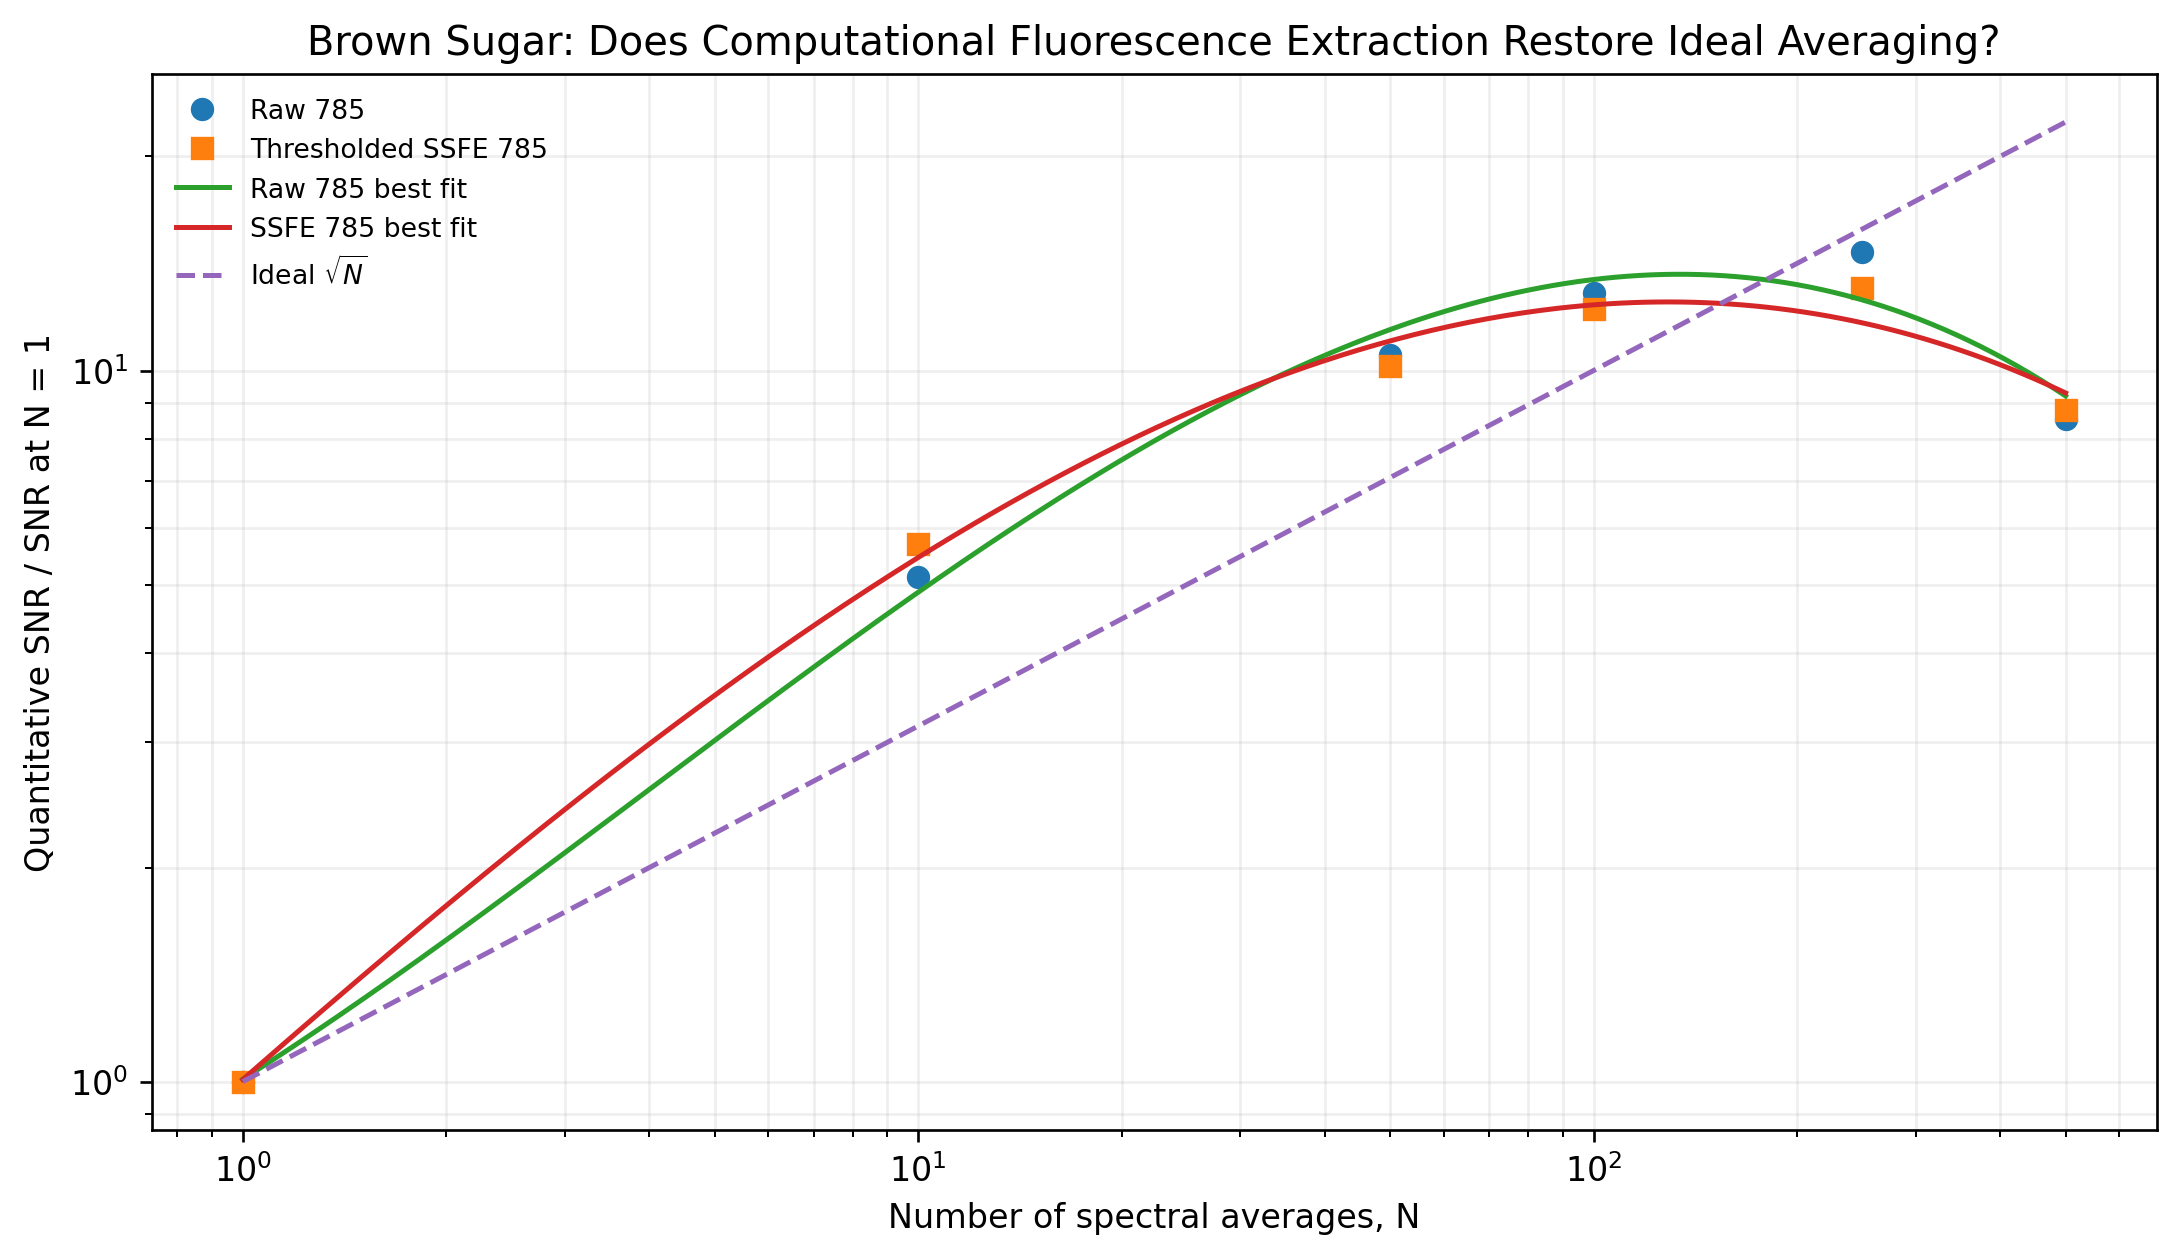
| Averages | Raw 785 SNR | SSFE SNR |
|---|---|---|
| 1 | 13.8 | 15.0 |
| 10 | 70.8 | 85.5 |
| 50 | 145.3 | 152.3 |
| 100 | 177.6 | 183.2 |
| 250 | 202.4 | 195.9 |
| 500 | 118.1 | 131.9 |
Figure 6. Brown sugar quantitative SNR versus number of averages before and after the SSFE processing. SNR is normalized to the one-average result for each treatment. The dashed line is the ideal √N relationship.
This result is physically expected. If Raman and fluorescence photons are both detected, the instantaneous measurement contains statistical fluctuations associated with both populations. A subsequent algorithm can estimate and remove the mean fluorescence contribution from the displayed spectrum, but it cannot retrospectively identify and remove the photon-counting fluctuation produced by each fluorescence photon. In simplified form:
σmeasured² = σRaman² + σbackground² + σdetector² + σdrift²
Computational fluorescence extraction and optical fluorescence suppression are therefore complementary but not equivalent. The former can recover spectral structure. The latter reduces the unwanted photon population before detection and thereby reduces both the background burden and the noise associated with that population. The present experiment does not isolate fluorescence shot noise from all other noise sources, so this conclusion should be understood as a measurement-level interpretation rather than a direct decomposition of individual noise terms.
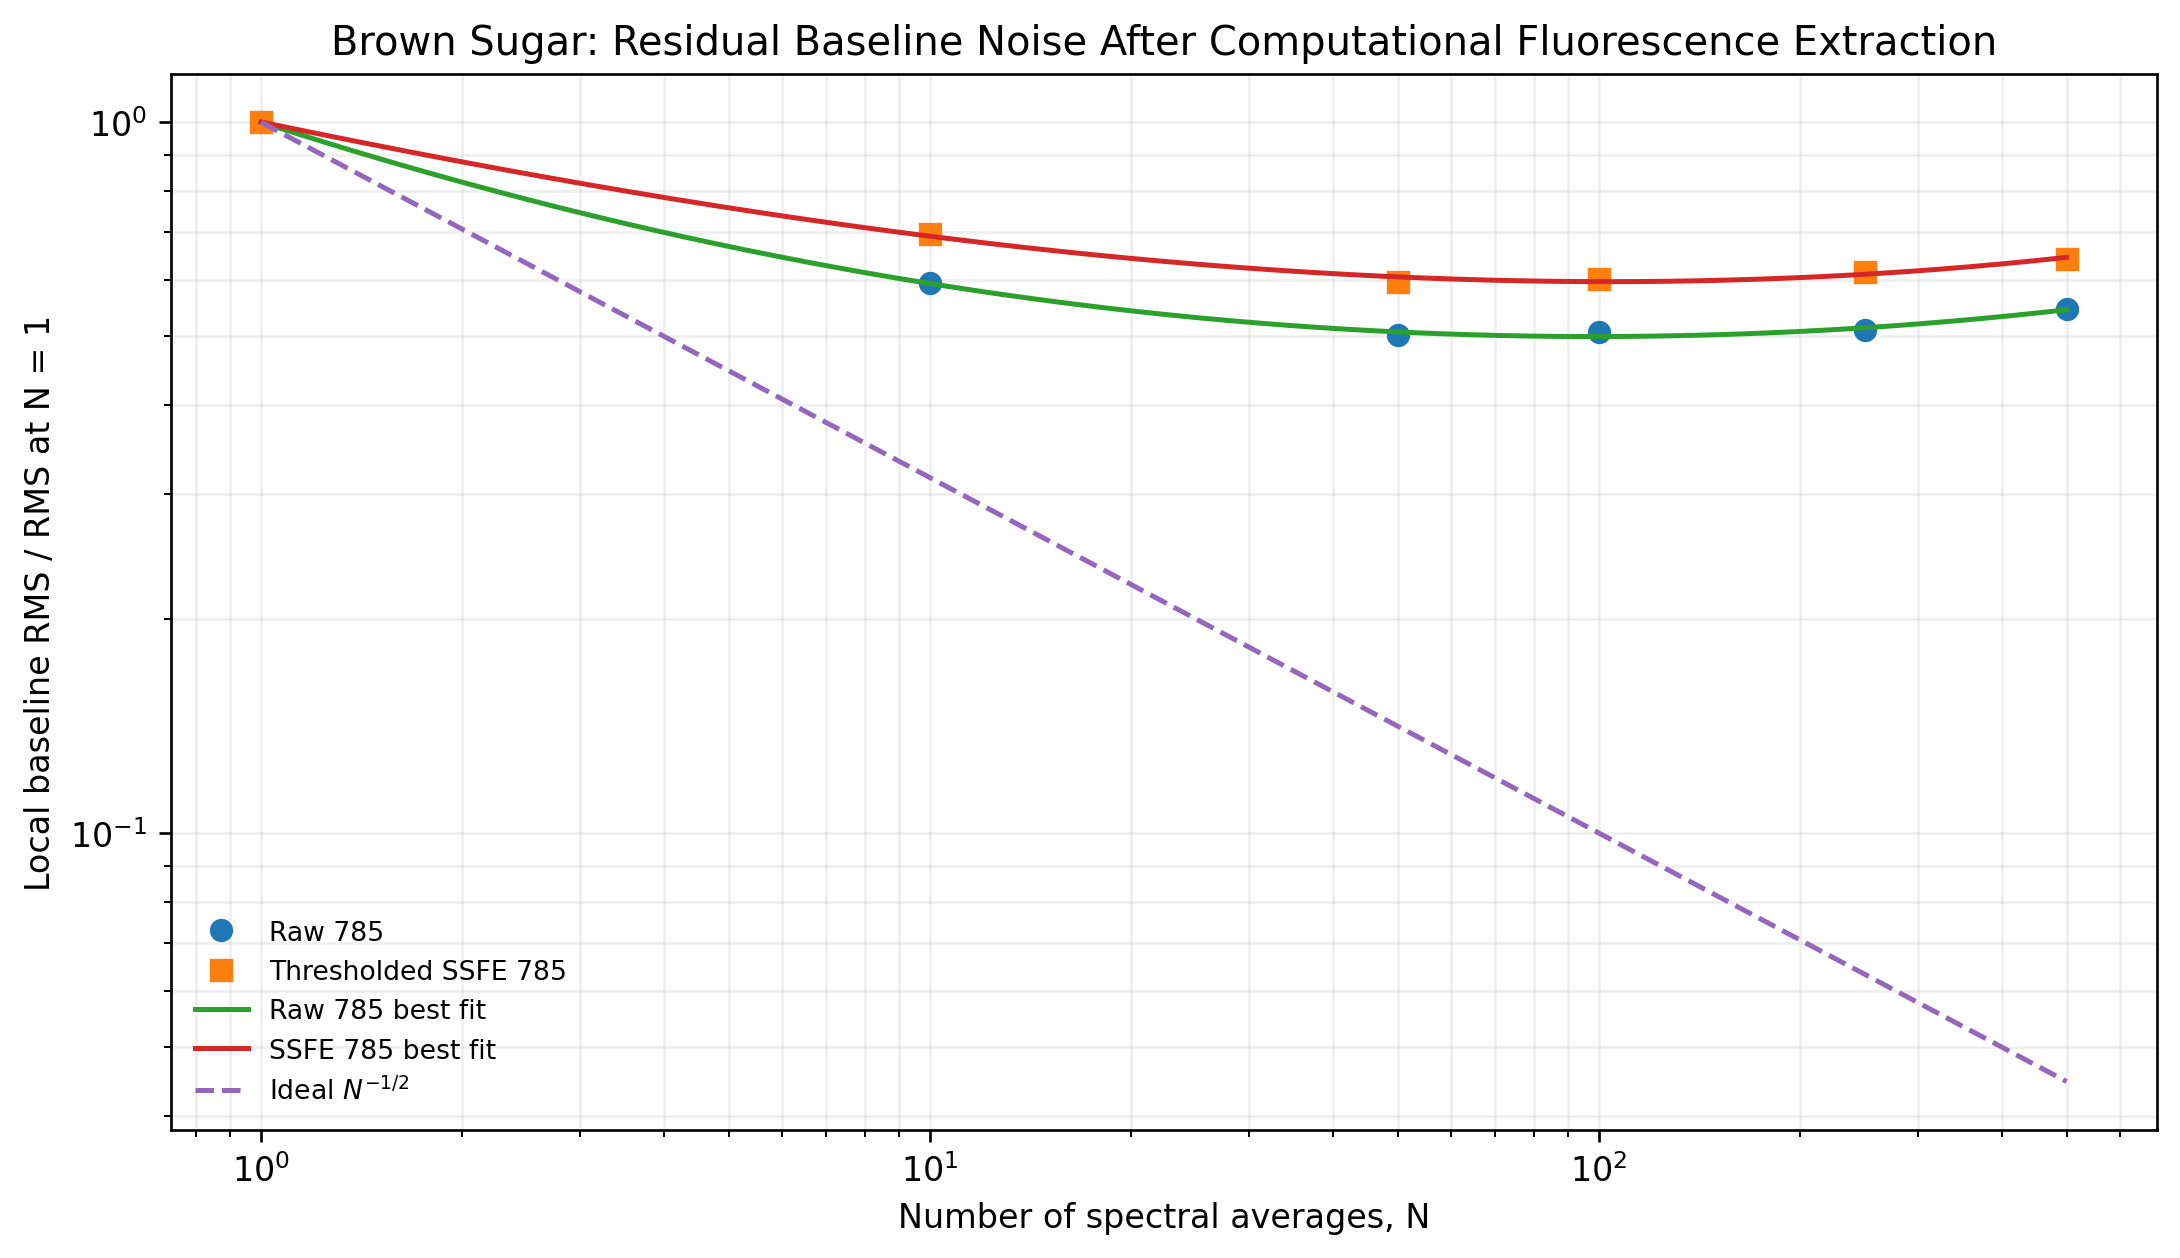
Figure 7. Local baseline residual RMS versus averaging before and after SSFE processing, normalized to the one-average value. SSFE processing reduces the absolute local residual, but the normalized residual still departs strongly from ideal N⁻¹ᐟ² averaging.
10. Cyclohexane: The Repeatability-Limited Control
Cyclohexane provides a useful qualitative control on the averaging experiment because fluorescence is minimal. Vantix quantitative SNR increases from approximately 44 at one average to approximately 181 at 10 averages, after which the measured values remain broadly in the 145 to 212 range through 500 averages. This early plateau shows that even in a clean sample, sufficiently precise measurements eventually become limited by effects other than independent random noise.
The commercial 785 nm cyclohexane data show unusually high short-term replicate precision followed by a pronounced decrease at higher averaging levels. Because the short-N precision is exceptionally high, small systematic changes dominate the calculated replicate SNR. We therefore do not use the 785 nm cyclohexane curve as a primary comparative claim. Its value is to reinforce the general conclusion that √N averaging is an asymptotic ideal, not a guarantee over arbitrarily long acquisitions.
11. Interpretation: Quantitative Precision and Qualitative Spectral Fidelity
SNR (I) established that the intrinsic wavelength penalty can be measured cleanly in low-fluorescence cyclohexane and that brown sugar fluorescence can make the 785 nm Raman signal a small contribution on top of a much larger optical background. SNR (II) adds the time dimension. Averaging initially improves quantitative precision, but the improvement eventually becomes limited by non-random variation. The measurement with the cleaner Raman background also provides a spectrum that more directly represents the sample vibrational structure.
For quantitative process applications, this means that Vantix should be evaluated by the repeatability and stability of the analytical variable at the required process time resolution. Integrated peak areas remain appropriate because they are less sensitive than peak height to spectral sampling and line-shape changes. The optimum averaging level should be established experimentally and should normally be near the onset of the repeatability plateau.
For qualitative applications, a second criterion becomes important: how much processing is required before the spectrum resembles the chemistry of the sample? Computational fluorescence removal can be valuable and, as the SSFE experiment demonstrates, can recover substantial Raman structure. Vantix addresses the problem earlier in the measurement chain by suppressing much of the fluorescence optically through 1064 nm excitation.
11.1 The Vantix Advantage
The Vantix Advantage in spectral averaging is not a claim that Vantix always has the highest numerical SNR. In a clean sample, shorter-wavelength excitation retains its intrinsic Raman SNR advantage. The advantage appears when background and sample behavior become part of the measurement: Vantix begins with a cleaner spectrum, its brown sugar local baseline residual decreases more effectively over the initial averaging range, and individual spectra reproduce the low-fluorescence reference with a high coefficient of determination.
Averaging reduces random noise. It does not remove the photons that created the background in the first place. For fluorescence-limited samples, suppressing that background before detection can therefore be more valuable than attempting to recover the same information by longer averaging or more aggressive preprocessing.
12. Where This Matters: Industries Commonly Affected by Raman Fluorescence
Fluorescence interference at 785 nm (and shorter wavelengths) is a widely recognized, long-documented challenge in Raman spectroscopy, not something specific to the two samples tested in this paper. The industries and sample types below are general examples, well known across the Raman literature, where practitioners routinely encounter fluorescent backgrounds similar in character to the brown-sugar case above. They are included here as context for where the Vantix Advantage is likely to be most relevant to your own work, not as additional test data from this study.
Pharmaceuticals and formulated products. Active pharmaceutical ingredients, excipients, coatings, and colored formulations frequently fluoresce under visible and near-infrared excitation, complicating polymorph identification, blend uniformity checks, and raw-material verification.
Food, agriculture, and natural products. Sugars, caramelized or roasted materials, plant matrices, and other naturally colored or organic samples, brown sugar being a direct example, are classic sources of strong fluorescence backgrounds.
Forensics and trace evidence. Dyes, inks, biological residues, and aged or degraded materials often carry fluorescent components that can overwhelm a Raman signal at shorter excitation wavelengths.
Polymers, rubber, and carbon-filled materials. Additives, pigments, carbon black, and degradation products are well-documented fluorescence sources in polymer and elastomer analysis.
Art conservation and cultural heritage. Pigments, binders, varnishes, and aged organic coatings are notoriously fluorescent, making longer-wavelength excitation a standard tool in this field.
Minerals, gemstones, and geological samples. Trace-element and mineral fluorescence is common and can vary significantly between specimens.
Cannabis and botanical extracts. Chlorophyll and other plant pigments are strong, well-known fluorophores that interfere with Raman analysis of botanical materials.
If your samples fall into any of these categories, or simply produce a sloped, high background under your current 785 nm system, the mechanism demonstrated here with brown sugar is likely to apply to your own measurements as well.
13. Conclusions
• Quantitative Raman SNR initially improves with spectral averaging, but the ideal √N relationship applies only while statistically independent random noise dominates.
• Brown sugar measurements on both instruments enter a repeatability-limited regime at high averaging. More averages are therefore not automatically better for quantitative or process measurements.
• Vantix brown sugar local baseline residual noise falls to approximately 25% of its one-average value by 50 averages, compared with approximately 50% for the 785 nm system. Both eventually reach non-random floors.
• Spectral fidelity provides information that replicate peak-area SNR does not. Vantix brown sugar spectra correlate very strongly with the low-fluorescence 1064 nm reference, including r² = 0.986 in the C-H region.
• SSFE computational extraction can recover substantial Raman structure from fluorescence-dominated 785 nm data, demonstrating the value of sophisticated preprocessing. It does not, however, restore indefinite √N averaging or remove noise that was generated during the original optical measurement.
• For PAT, the optimum number of averages should be selected from quantitative precision versus acquisition time. For qualitative analysis, the amount of preprocessing required to obtain a chemically faithful spectrum should be considered as an additional performance metric.
SNR (I) asked how excitation wavelength and fluorescence affect quantitative Raman precision. SNR (II) shows that spectral quality has two dimensions: the precision of the analytical measurement and the fidelity of the spectrum from which that measurement is derived. For difficult samples, the most useful Raman system is not necessarily the one that collects the most photons. It is the one that delivers the most trustworthy chemical information within the required measurement time.
Talk to SKM Instruments
If fluorescence, photobleaching, or baseline drift are limiting what your current Raman system can tell you, we would welcome the chance to look at your samples directly. SKM Instruments can discuss a demonstration of Vantix 1064 FT-Raman on your own material or walk through how these results apply to your specific analytical challenge.
Contact SKM Instruments