
Vantix 1064™: FT-Raman with 1064 nm Excitation
Fluorescence Reduction and Extended Spectral Range
Raman spectroscopy is a versatile analytical technique capable of supporting applications ranging from bioprocess monitoring to field-based chemical identification, mineral analysis, and product quality verification. Its ability to provide rapid, non-destructive, and reagent-free measurements makes it attractive for deployment both inside and outside of controlled laboratory environments.
While current Raman implementations emphasize the information-rich fingerprint region (200–1800 cm−1) for chemical specificity, practical deployment across real-world matrices reveals a different operational reality. In complex systems such as biological media, field samples, agricultural products, and consumer goods, fingerprint-driven models are often limited by spectral overlap, fluorescence, and matrix variability.
Across these applications, the C–H stretching region (2800–3200 cm−1) consistently emerges as a dominant contributor to reliable quantitative and classification analysis. This region functions as a proxy for total organic content (TOC) and hydrocarbon structure, delivering high signal-to-noise ratio (SNR), reduced sensitivity to aqueous matrix interference, improved calibration stability under FT-Raman measurement, and enhanced model transferability across instruments and environments.
SKM Instruments’ Vantix 1064, is a unique FT-Raman system strategically positioned to exploit these characteristics through high optical throughput, intrinsic wavelength calibration, and single-channel detection. This whitepaper examines the scientific basis for C–H-region-centric Raman analysis, details the architectural advantages of the Vantix 1064, and presents application-specific evidence across bioprocessing, hazardous material identification, food and agriculture markets.
Implications Across Key Markets
The value of C–H-region-centric Raman analysis extends across a range of industries where sample complexity, environmental variability, and fluorescence interference limit conventional fingerprint-based approaches. The table below highlights three key markets where FT-Raman at 1064 nm delivers measurable analytical advantages.
Vantix 1064 Technology Overview
Like all Fourier Transform Raman (FT-Raman) systems, SKM Instruments’ Vantix 1064 platform possesses inherent characteristics of the FT architecture:
Jacquinot’s Advantage (throughput): Enables large-area sampling and improved spatial averaging of heterogeneous materials.
Connes’ Advantage (calibration): Provides intrinsic wavelength accuracy and long-term stability without recalibration drift.
Single Channel Detection (SNR): Provides a significant SNR over multichannel detectors.
What makes SKM Instruments’ Vantix 1064 so special?
Vantix 1064 represents a reimagining of FT-Raman architecture. The specific design choices embodied in this new instrument are detailed below:
Absolute Calibration Stability
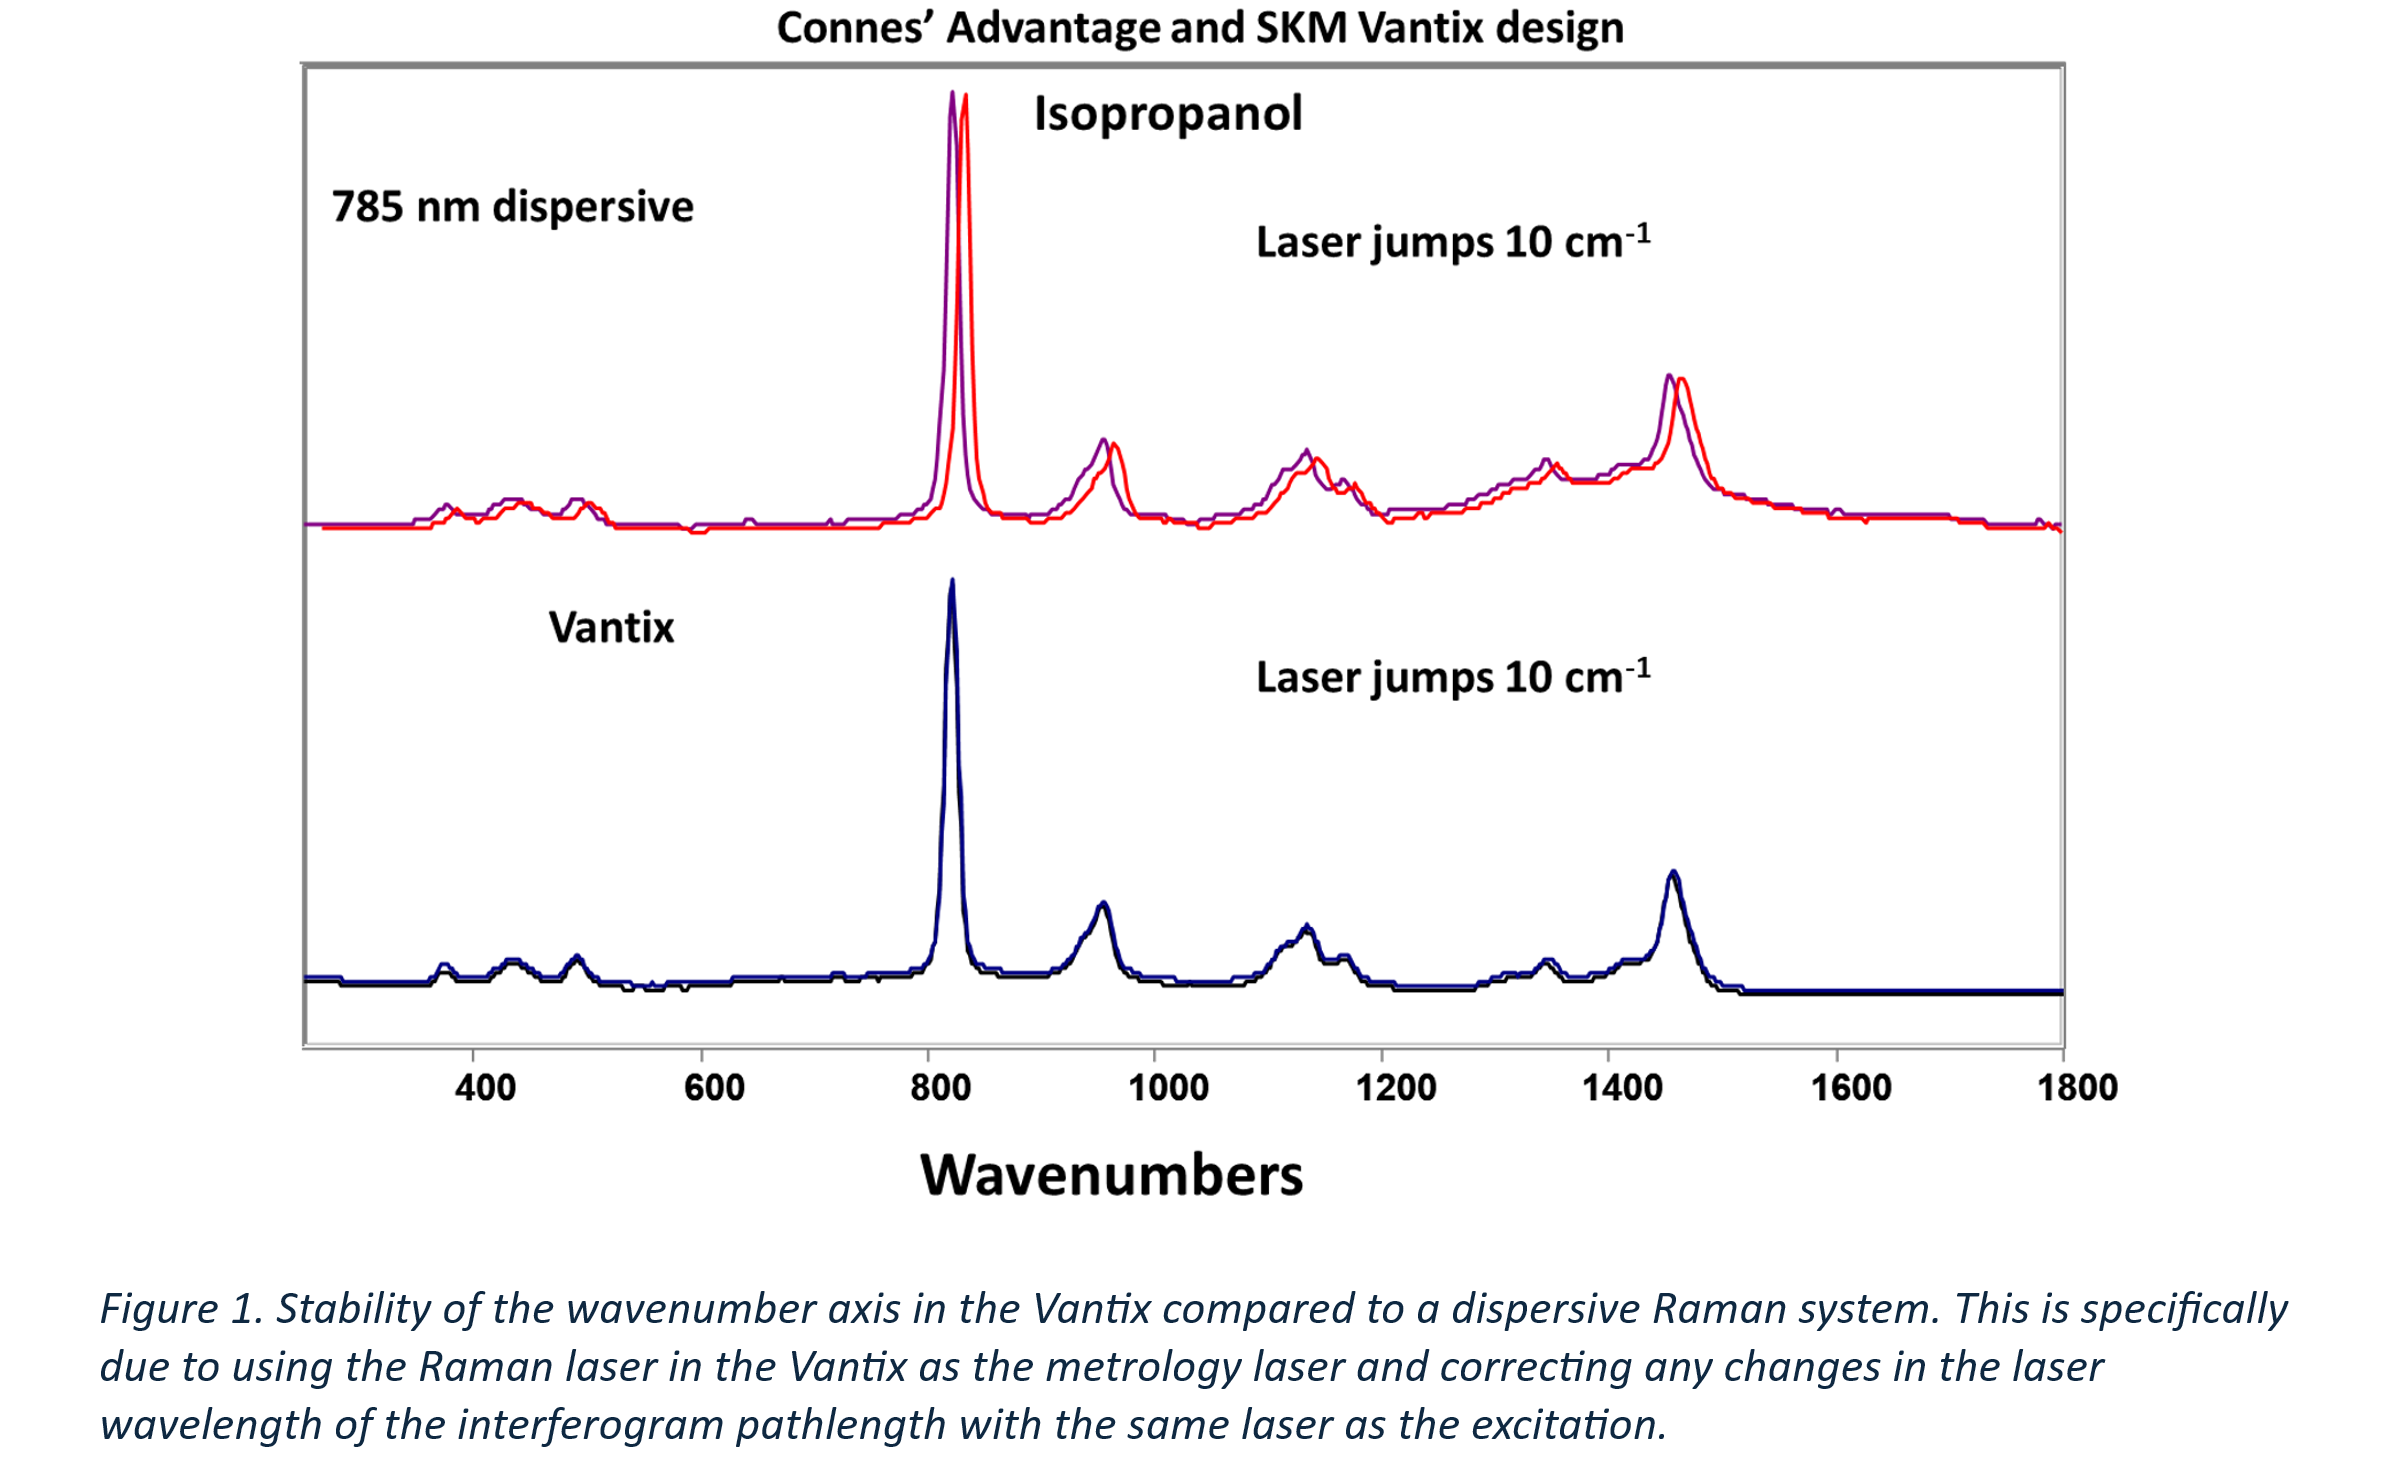
In typical FT spectrometers, wavelength calibration is achieved by using a separate internal reference laser to provide intrinsic accuracy and long-term spectral reproducibility without recalibration drift. The Vantix 1064 eliminates this with a proprietary self-referencing design: the Raman excitation laser itself serves as the metrology laser for the interferometer, so that any change in excitation wavelength is automatically corrected in the interferogram path-length computation. This is illustrated in Figure 1. The result is wavenumber-axis stability that tracks the excitation source directly, a feature essential for stable chemometric models and long-term measurement consistency.
Single-Channel Detection: InGaAs APD vs. InGaAs Arrays and CCD detectors
Silicon CCD detectors offer good pixel uniformity but are limited to wavelength range in the near infrared. On the other hand, InGaAs arrays detectors extend the wavelength range but suffer from structured artifacts which arise from even/odd gain differences due to dual (or multi) readout amplifier architectures, where alternating pixels are routed through different analog paths that cannot be perfectly matched. This introduces distortions in the acquired spectrum that can confound chemometric analysis.
The Vantix 1064 uses a single-element InGaAs APD, which avoids these structured array artifacts entirely. Single element detectors provide a fundamentally cleaner intensity axis free from the pixel-to-pixel gain patterns that plague array-based systems, even though they retain their own noise characteristics (e.g., dark current and gain nonlinearity).
Quantum Efficiency Considerations
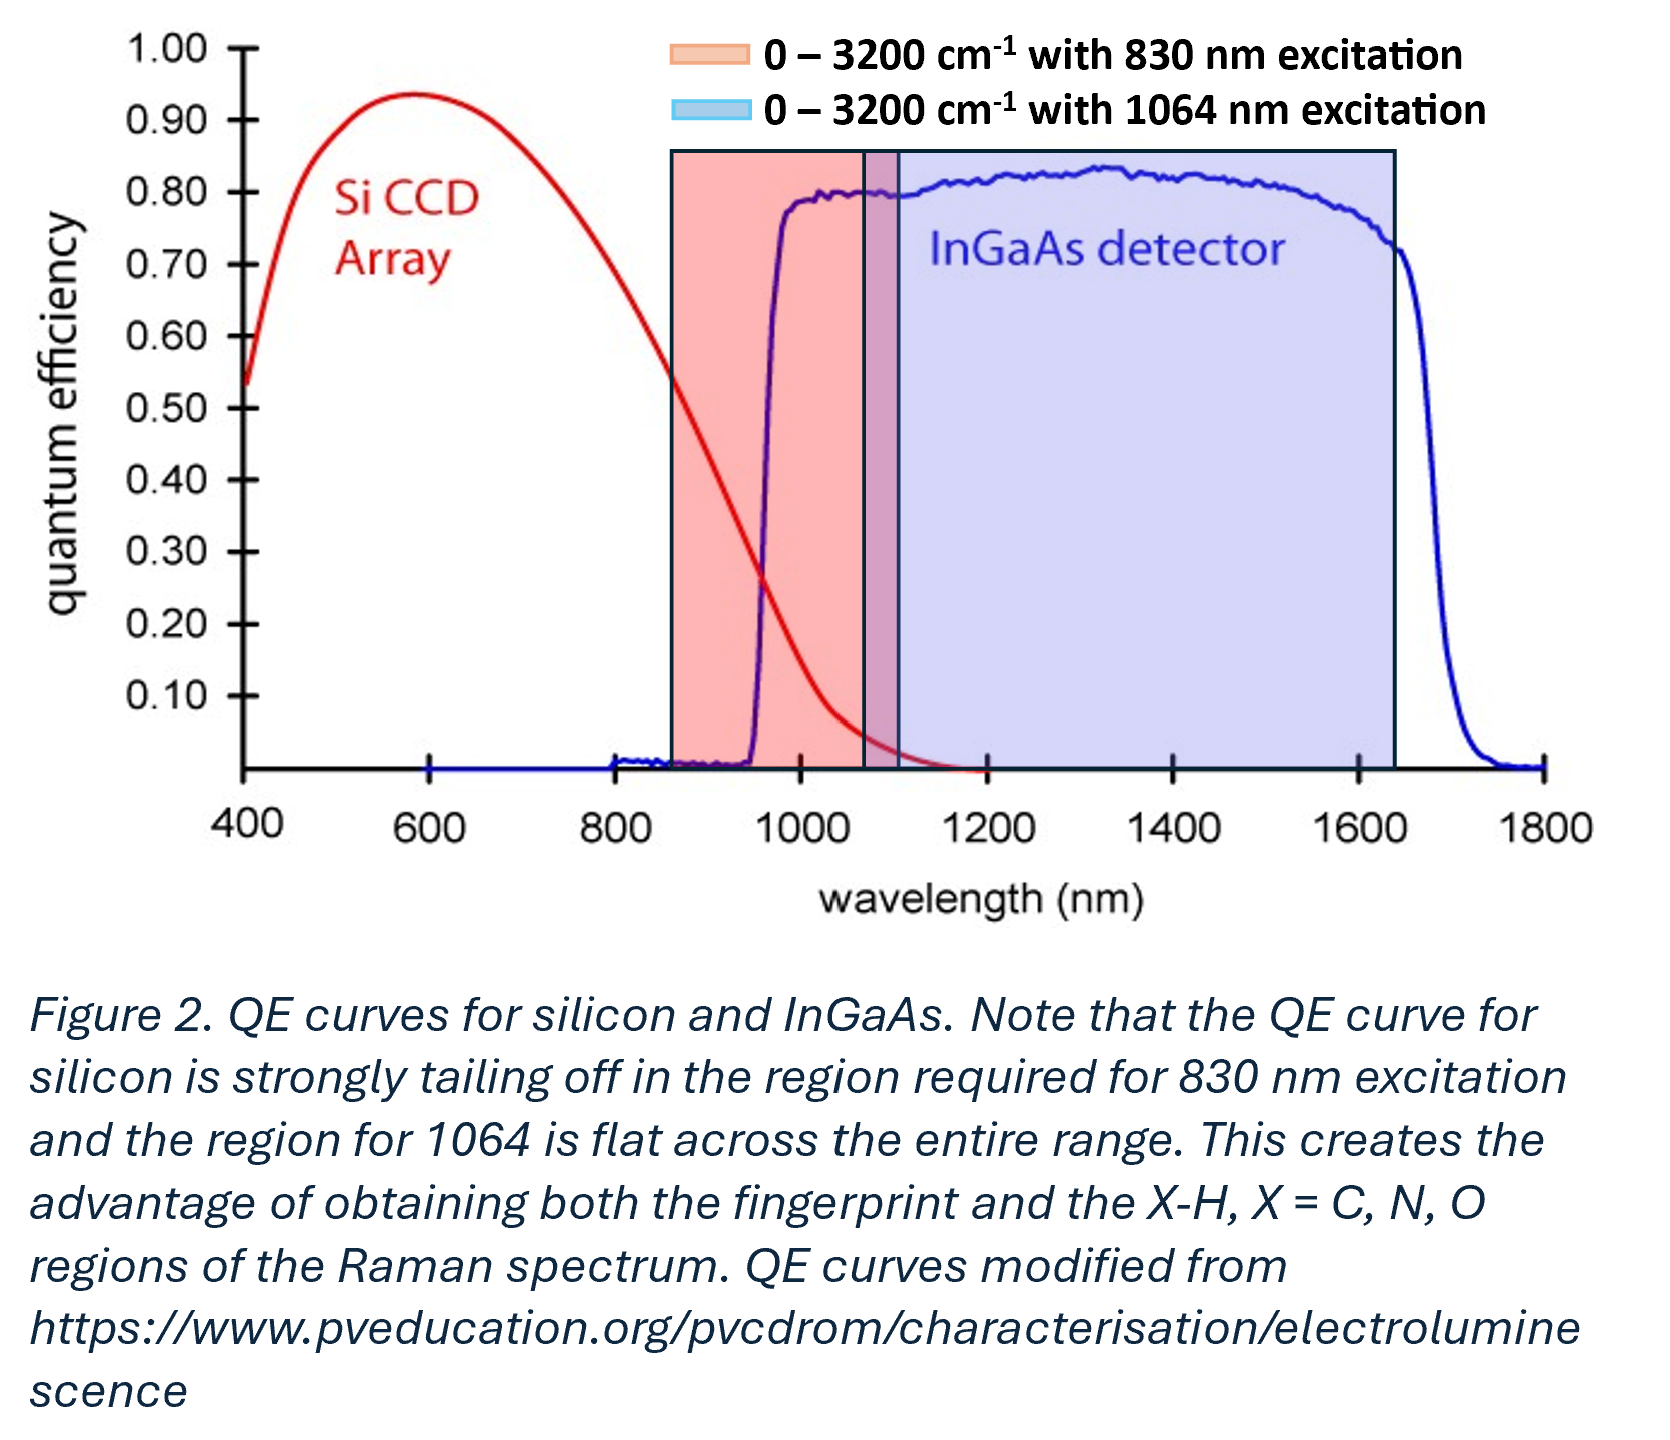
For 830 nm excitation Raman systems, the scattered light extends into a region where silicon CCD response is strongly tailing off, resulting in diminished sensitivity at higher Raman shifts. In contrast, the Vantix 1064 InGaAs detector response at wavelengths corresponding to 1064 nm excitation Raman (covering 0–3200 cm−1) is virtually flat. This flatness enables consistent sensitivity across both the fingerprint and the X–H stretching regions (where X = C, N, O), allowing the Vantix 1064 to acquire the full spectral range without the sensitivity roll-off that limits 830 nm dispersive systems. This is illustrated in Figure 2.
Vantix 1064 in Bioprocess Environments
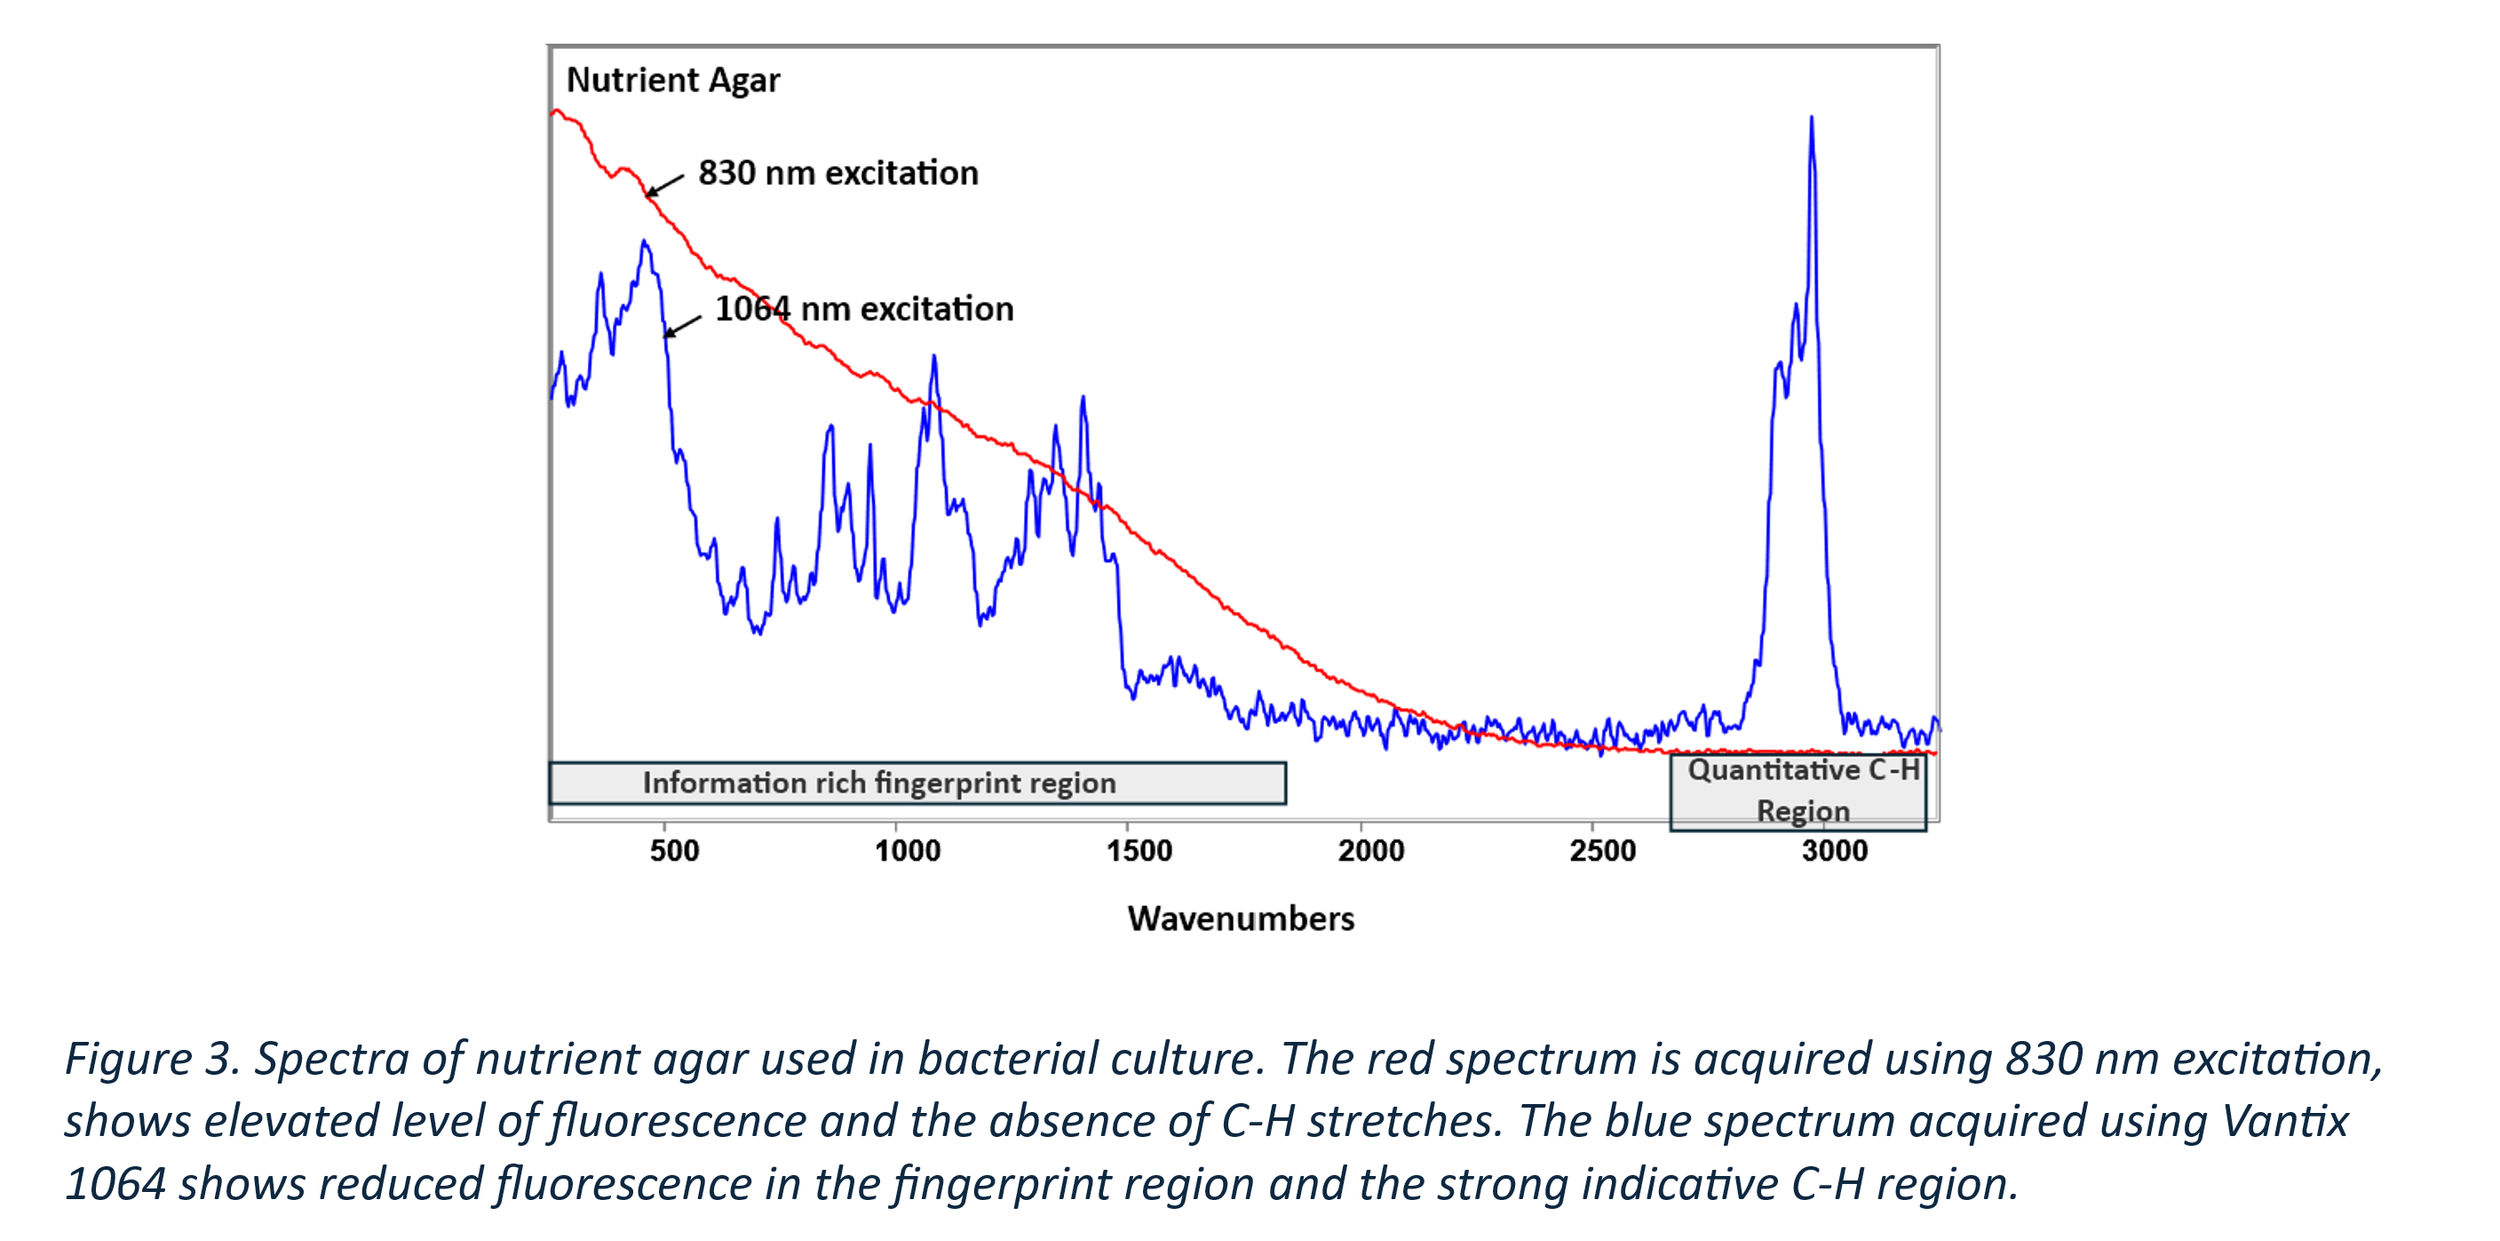
Bioreactors present one of the most challenging environments for spectroscopic measurement, characterized by high turbidity, scattering, fluorescence, complex evolving chemical matrices, strong spectral overlap between components, and low analyte contrast relative to bulk media. The Raman spectra of nutrient agar acquired using 830 nm and 1064 nm excitation is presented in Figure 3 as an example of a complex biological matrix, showing the distinctive features visible under different laser excitation.
Under these conditions, the theoretical strengths of Raman spectroscopy must be evaluated against practical signal stability and model robustness, not just spectral interpretability. In real-world bioprocess Raman spectroscopy, the dominant question is not “Where is the most chemically specific information?” but rather “Where is the most stable, scalable, and transferable signal?”
The Functional Role of the C–H Region
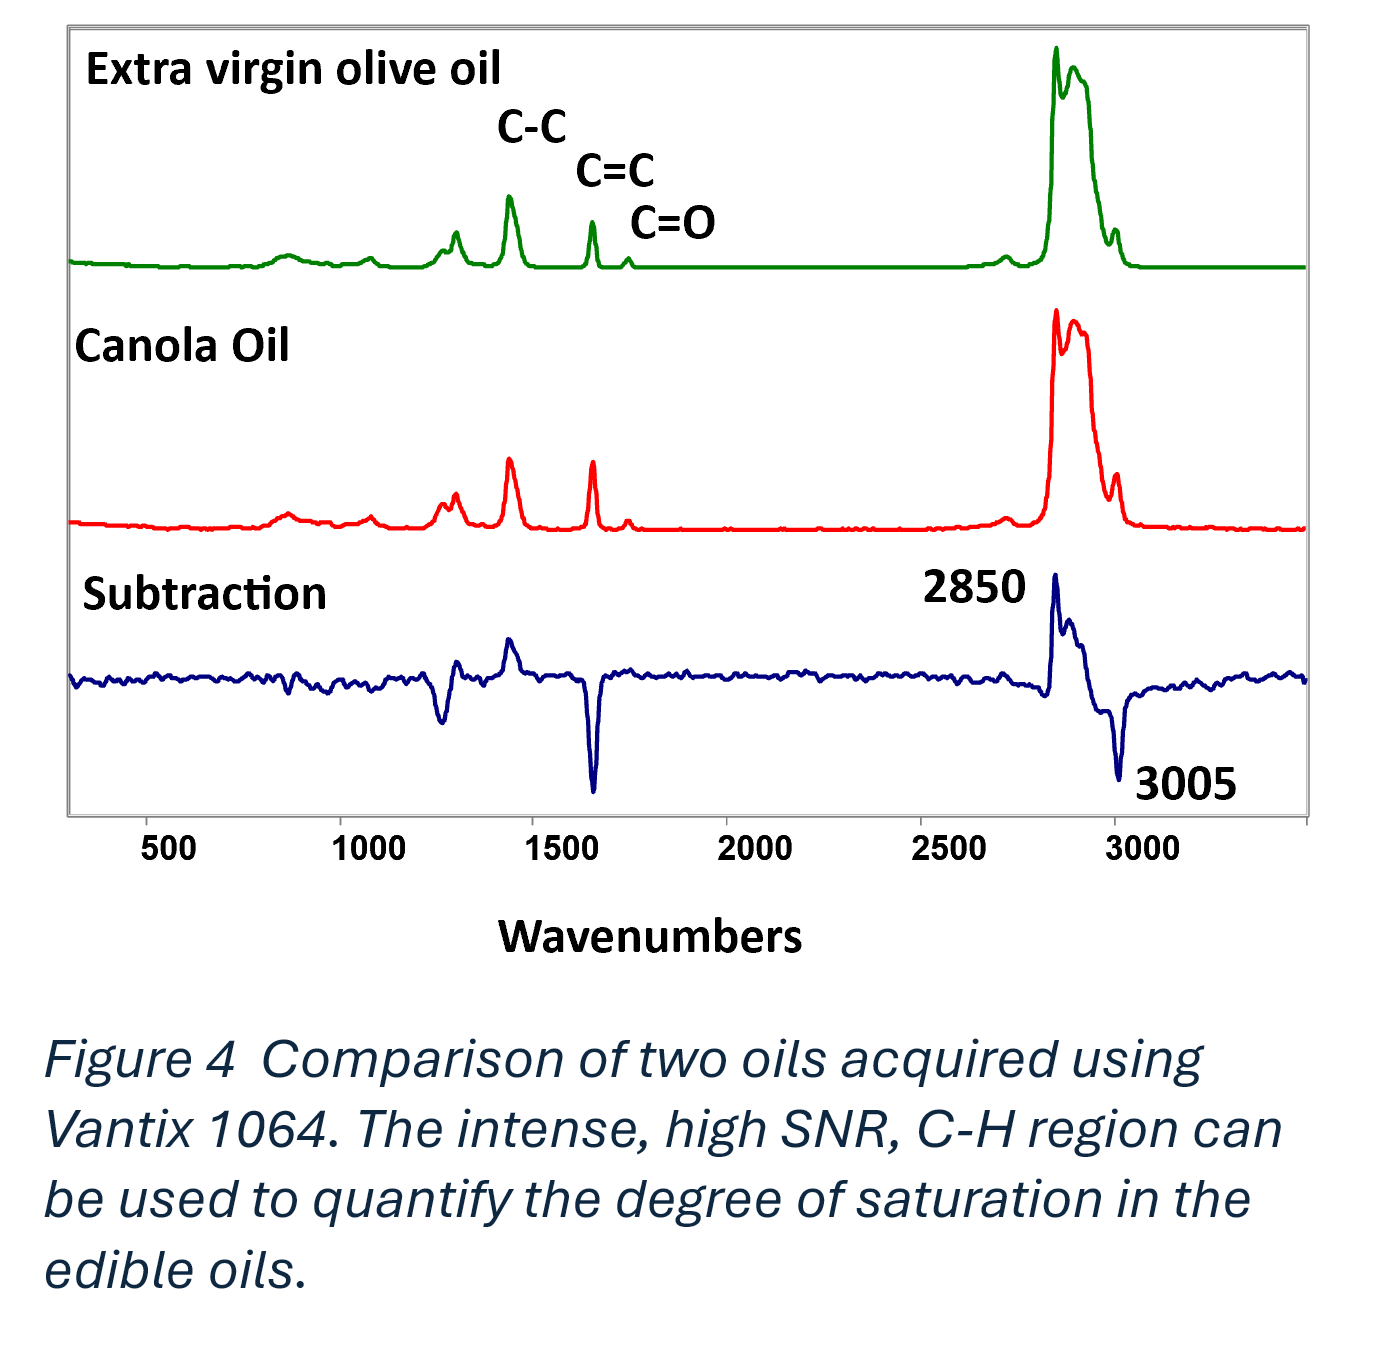
The C–H stretching region (2800–3200 cm−1) arises from CH, CH2, and CH3 vibrations from aliphatic carbons in nutrients, as well as olefinic CH2 and aromatic CH vibrations from nutrient carbons. This region effectively measures total organic density, integrating contributions from nearly all carbon-containing species in a sample. We can define an index to show the degree of saturation as
Saturation Index = Intensity (2850 cm−1) / Intensity (3005 cm−1)
This is illustrated in Figure 4 for extra virgin olive oil and canola oil. Olive oil is known for its high level of monounsaturated fatty acids (oleic acid) while canola is known for its polyunsaturated fatty acids (PUFA) that are suggested to cause inflammation. This spectrum demonstrates that Raman spectroscopy can distinguish oils based on molecular unsaturation alone, with the strongest and most reliable information contained in the C–H stretching region.
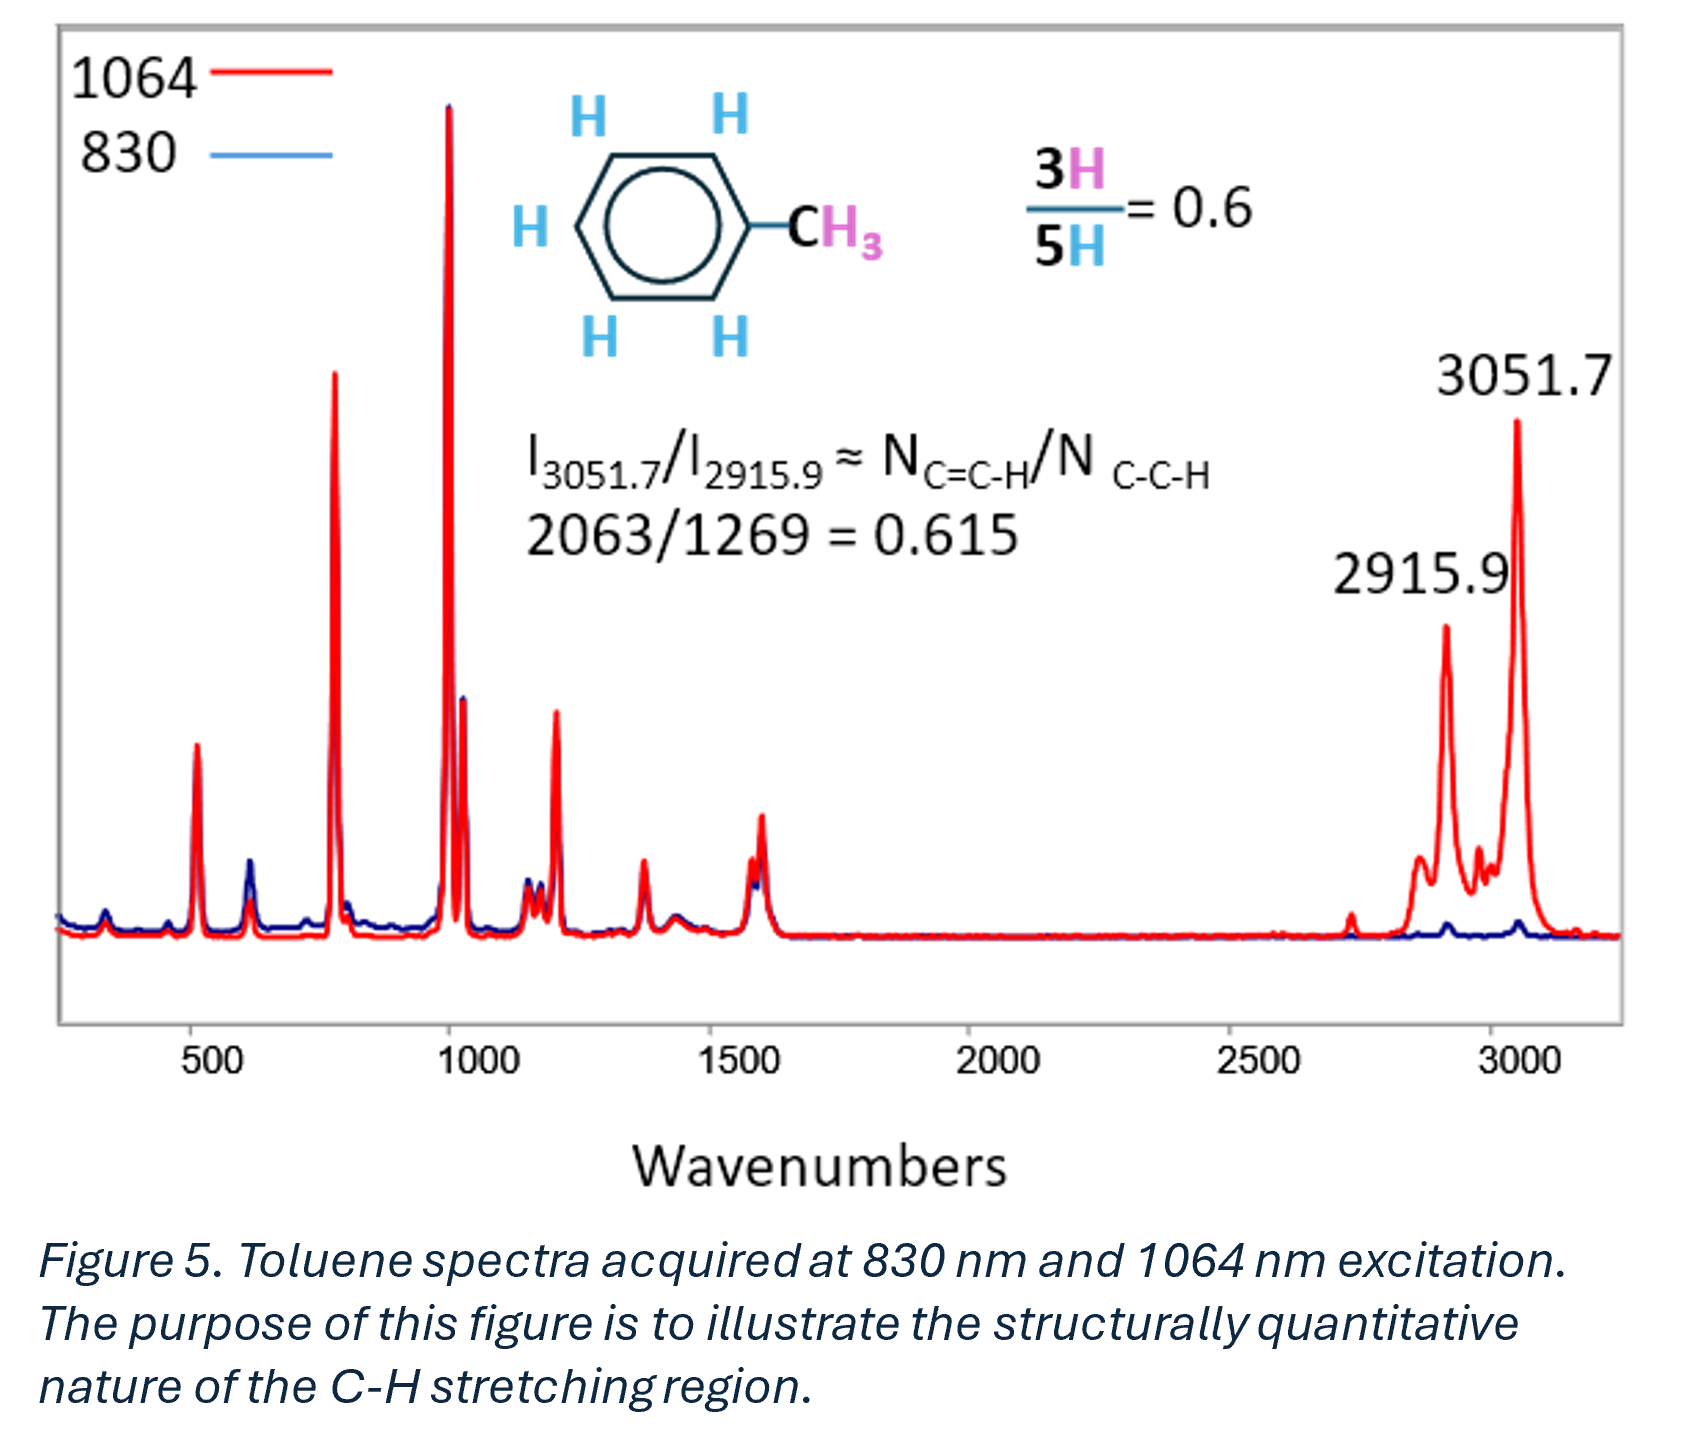
Toluene (C6H5CH3) provides a straightforward illustration of the structurally quantitative nature of the C–H stretching region. Its simple structure—a single aromatic ring with a methyl group—yields 5 aromatic C–H bonds and 3 aliphatic C–H bonds on the methyl group, giving a theoretical aliphatic-to-aromatic intensity ratio of 0.600. Measurement of the Vantix 1064 spectrum yields an experimental ratio of 0.615, demonstrating close agreement between bond count and measured intensity.
Why Fingerprint-Only Strategies Fail in Practice
Despite its chemical elegance, the fingerprint region is subject to several practical limitations when applied to complex, real-world matrices. Severe spectral overlaps in multi-component media makes it difficult to isolate individual analyte contributions. Signals from low-concentration analytes are often weak relative to the matrix background. The region is sensitive to baseline drift and fluorescence, both of which vary with sample composition and environmental conditions. Additionally, fingerprint features often show poor transferability across instruments and measurement runs due to their sensitivity to spectrometer calibration and alignment.
As a result, chemometric models relying heavily on fingerprint features tend to exhibit overfitting to specific instrument or batch conditions, poor robustness when applied to new samples, and limited scalability across production environments. These limitations motivate the use of the C–H region as a primary or complementary modeling target.
Vantix 1064 Advantage in the C–H Region
The architectural features described in Section 3 converge to make the Vantix 1064 particularly well-suited for C–H-region-centric analysis. Jacquinot’s throughput advantage enables large-area sampling and spatial averaging over heterogeneous samples. Fellgett’s multiplex advantage enhances SNR across broad spectral regions. Connes’ calibration stability, further enhanced by the Vantix’s self-referencing metrology, eliminates drift-induced model degradation. Together with the flat QE response of the InGaAs APD across the full Raman range, these characteristics deliver measurement quality that supports robust, transferable chemometric models.
Vantix 1064 Enables Model Transferability
A critical requirement for industrial deployment of Raman-based analytical methods is the ability to transfer calibration models between instruments, production batches, and measurement environments without significant loss of predictive accuracy.
C–H-dominant models exhibit several properties that favor transferability. First, the broad, intense bands in the C–H region are less sensitive to slight differences in spectrometer calibration and resolution than the narrow, overlapping features of the fingerprint region. Second, total organic content measured via the C–H region shows reduced sensitivity to matrix variation – changes in media composition, turbidity, or background fluorescence have a proportionally smaller effect on the C–H signal than on fingerprint features. Third, the intrinsic calibration stability of Vantix 1064 ensures that the wavenumber axis remains consistent over time and across instruments, which is a prerequisite for model transfer.
Additionally, changes in the broad O–H stretching region (which partially overlaps with C–H bands near 3200 cm−1) can serve as an indicator of water formation or consumption due to chemical reactions – providing an additional dimension of process information without requiring separate measurements.
For applications requiring differentiation of structurally similar compounds, complementary analysis of both regions of both the fingerprint and high-wavenumber regions can be achieved simultaneously with the extend range of the Vantix 1064.
These factors result in improved cross-batch reproducibility, better instrument-to-instrument transfer, and more stable long-term model performance compared to fingerprint-only approaches.
Conclusion
In real-world Raman applications, success depends not on maximizing chemical specificity alone, but on identifying spectral regions that provide strong signal, robust behavior across matrices, and stability over time and across instruments. Across bioprocessing, hazardous material identification, and food and agriculture markets, the C–H stretching region consistently meets these criteria.
SKM Instruments’ Vantix 1064 is architecturally optimized to exploit the C–H region through high-throughput optical design (Jacquinot’s advantage), intrinsic calibration stability (Connes’ advantage, enhanced by self-referencing metrology), large-area sampling with spatial averaging, and a single-channel InGaAs APD that provides a clean intensity axis free of structured array artifacts.
This combination enables a shift from laboratory spectroscopy to true industrial analytics – delivering measurement robustness, model transferability, and field deployability at scale.